Analyzing Time-Series of Individual Data – Part2: Using Harmful/Trivial/Beneficial Chances
Just a quick update – after a comment by John Fitzpatrick (@JFitz138) on the use of Will Hopkins’s approach of calculating chances I decided to give it a shot.
For a Typical Error (used together with SWC to calculate chances) I used SD of the Rolling Average.
To calculate chances I have coded simple VBA function that use NORM.DIST function of Excel.
To calculate chances, one must assume that data points in Rolling average are normally distributed (and that might not be the case!) around their mean with SD. Here is my sketch:
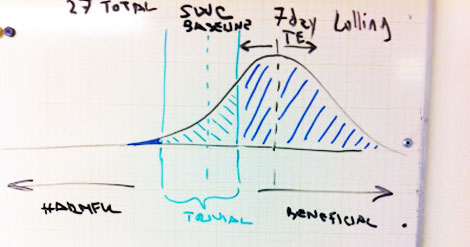
My wonderful drawing skills
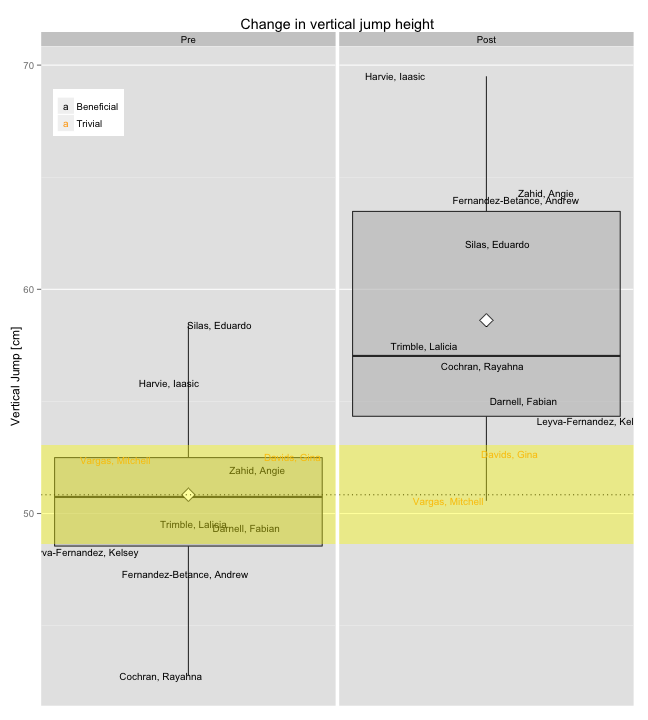
Even simpler approach than this might involve pure counting of days (data points) above, within and below baseline and SWC, especially for non-normally distributed data set (someone correct me if I said something stupid). Using Box and Whiske r plot and interquartile ranges might also seem possible solution.
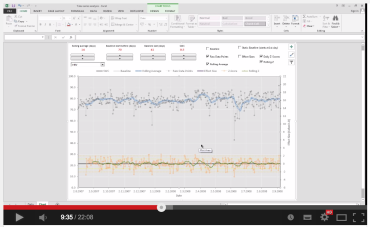
Anyway, here is the short video of the workbook and below you can find updated download link.


Responses