sRPE and Wellness Dashboard: Making Sense of Athlete Monitoring Data
Collecting Session RPE and wellness data is not the hard part. Turning that data into something reliable and useful is.
Missing entries. Double sessions on the same day. Athletes skipping questions. Days with no training scheduled at all. Each one forces a small decision about how the data should be handled. Those decisions quietly shape the story you think the data is telling. Most coaches end up exporting everything to CSV and opening spreadsheets.Hours go into cleaning, fixing, and reformatting. By the time it makes sense, new data is already coming in.
The Session RPE and Wellness Dashboard approaches this problem differently. It is explicitly built for AthleteSR’s. two built-in questionnaires: Morning Wellness and sRPE. Because the structure of these surveys is known, the dashboard can handle aggregation, missing values, and visualization without manual work.
Core benefits
- Use AthleteSR’s built-in questionnaires withouta custom setup
- Start analysis right away without building surveys or dashboards from scratch
- Sync data live and remove the need for repeated CSV exports
How the dashboard supports better decisions
- Aggregates double sessions correctly using sum for training load and mean for wellness ratings
- Handles missing entries and missing days explicitly instead of guessing
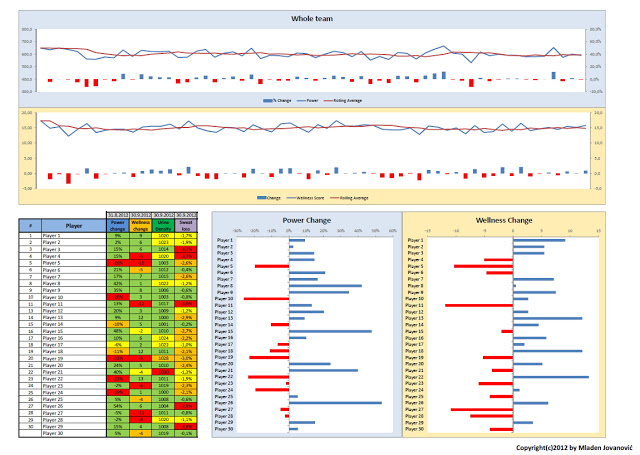
- Shows acute and chronic trends, variability, ratios, and effect sizes in one place
- Compares individual athletes with group medians and spread
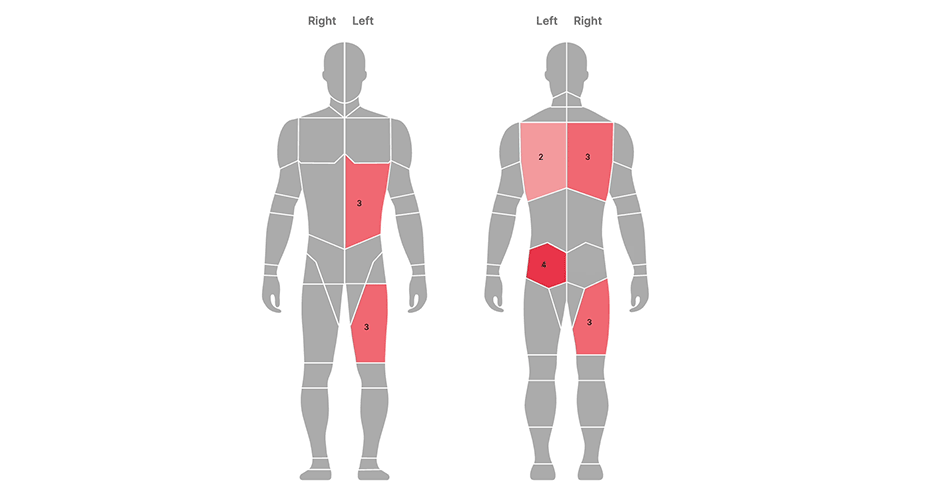
- Visualizes body soreness across recorded areas and tracks how it changes over time
- Provides debugging views so you can see what data is missing and how it is treated
- Inspect the raw data behind the charts to understand what is missing and why
This is not about prettier charts. It is about reducing noise, removing manual work, and trusting what your monitoring data is actually showing.
Below are two videos. The first is a short demo showing how the dashboard looks and how the main elements fit together. The second is a full walkthrough explaining how the dashboard prepares the data, how different assumptions affect the output, and how to read what you are seeing.
Demo Video
In-Depth Video
To gain more information about the underlying analysis, I urge you to check the Athlete Monitoring Course, as well as the in-depth video.


Responses