Estimating 1RM Using Load-Velocity Relationship
This article is originally written and published for Kinetic website. I wanted to thank Rob Shugg for posting it and the whole Kinetic Performance company for creating such an amazing tool – PowerTool/GymAware. Also, I hope that the article will bring some more food for thought and stimulate more work in this direction.
There has been recent interest in using load-velocity relationship in predicting 1RMs, especially now when the availability of LPTs (Linear Position Transducers) and accelerometers is increasing, along with their ease of use.
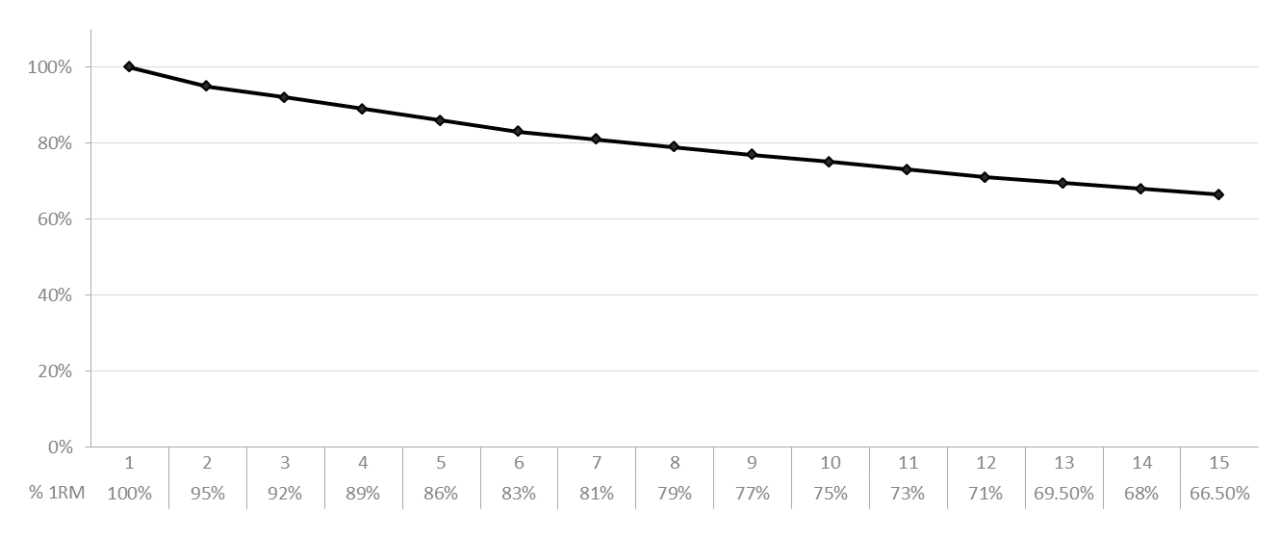
What has been widely used up to this point is load-endurance relationship, estimated by repetitions to failure. On the following picture is the visual representation of that relationship using data from Dan Baker. You can also see read more on that relationship here:
Before I commenced this little self-experiment and a play with GymAware I wanted to do a short literature review, so I can avoid pitfalls identified by the researchers. I have found couple full papers by using Google, Google Scholar and PubMed and I am reviewing them here.
Jidovtseff et al. 1 suggests measuring average velocity (AV) and not peak velocity (PV) for two reasons. First AV better represents the ability of the subject to move the load through the entire concentric phase. Second, AV decreases linearly with increasing load, making mathematical analysis easier.
Jidovtseff et al. 1 recommends measuring AV at 3 to 4 increasing loads with 3 to 5 separate trials at each load and a full recovery to get subject’s best performance. It is unnecessary to use very high loads, but the decrease in AV between the lightest and heaviest loads should reach at least 0,5 ms-1.
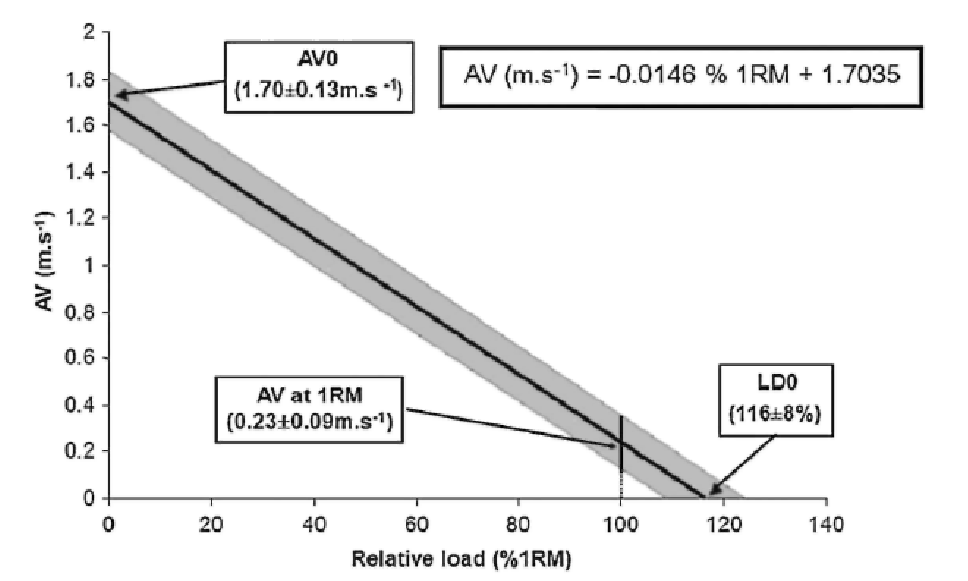
From Bosquet et al. 2
- Some commercial devices allow estimating 1 RM from the force-velocity relationship.
- These estimations are valid. However, their accuracy is not high enough to be of practical help for training intensity prescription.
- Day-to-day reliability of force and velocity measured by the linear encoder has been shown to be very high, but the specific reliability of 1 RM estimated from the force-velocity relationship has to be determined before concluding to the usefulness of this approach in the monitoring of training induced adaptations.
From Jidovtseff et al. 4
- Prediction of 1RM appears to be dependent on mathematical method, selected parameter (peak velocity versus average velocity), device, exercise and equipment.
- It is more accurate to predict the 1RM from the V1RM (M2) than from the 1RM-Ld0 relationship (M1)
- For traditional exercises like bench press and squat used with free weights or guided barbell the use of load-velocity relationship to predict the 1RM appears as accurate as traditional repetition-to-failure method and present the advantage of assessing at the same time the muscular velocity that is a very important component in many sports
So after this quick review I decided to do a short experiment using bench throw in the Smith Machine from a static position (3seconds pause at the chest), box squat (with 3 second pause on the box – not relaxing, just touching it) and bench press (again same 3 seconds hold). Concentric contraction was done with maximum intention to lift explosively.
For each load (kg) I did 3 trials and pick-up the best one as a score. I have also calculated CV% (coefficient of variation) to see which method is more reliable. The recovery in between trials was from 1 to 3 minutes.
Here is the short video I did while taking the data.
On the following table is the data for both Mean Velocity and Peak Velocity.


Correlation between best scores of Peak Velocity and Mean Velocity is 0,974. Average CV% (coefficient of variation) for sets calculated with Mean Velocity is 2,38% and for Peak Velocity it is 3,37%, which is 42% bigger.
Based on the recommendations from the references and based on the lower CV and thus typical error, I decided to use Mean Velocity as a method of calculating velocity.
Bench Throw
Apparently we have crappy Smith Machine, since my velocity is higher on the bench press than bench throw with the same weight. The path in the Smith Machine is leaned towards me, and maybe there is some friction adding up to the resistance (plus I assumed that unloaded bar is 20kg and it might be more). Anyway, here is the graph and linear regression:
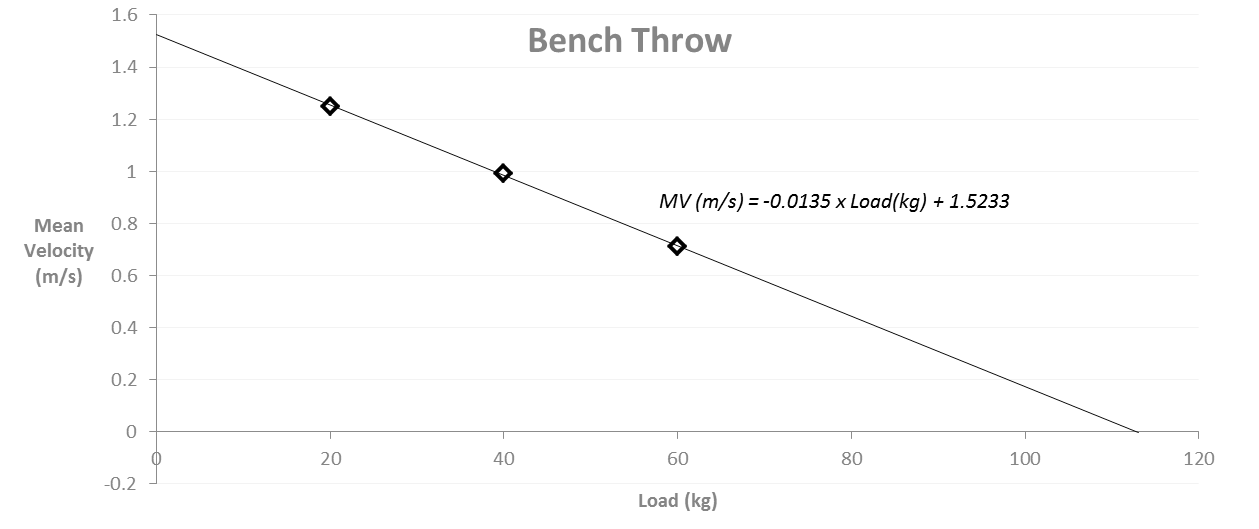
You can pretty easy create the linear regression formula in Excel. All you need is to create a Scatter chart (go to Insert Tab -> Scatter) and select weight data (in this case 20, 40 and 60kg) as X variable and velocities associated with those weights as Y variable.
When you are done with this you can add regression line. You need to click on the chart, then go on the Excel Ribbon to Chart Tools -> Layout -> Trend line -> More trend line options. The window will pop-out and you should select Linear button and Display Equation on Chart box. That’s it.
From the linear regression formula we can calculate LD0 (load when velocity is zero) and MV0 (velocity when load is zero).
LD0 = 112,83 kg<
MV0 = 1,52 ms –1
Bench press
On the following picture you can see scatter plot and linear regression equation.
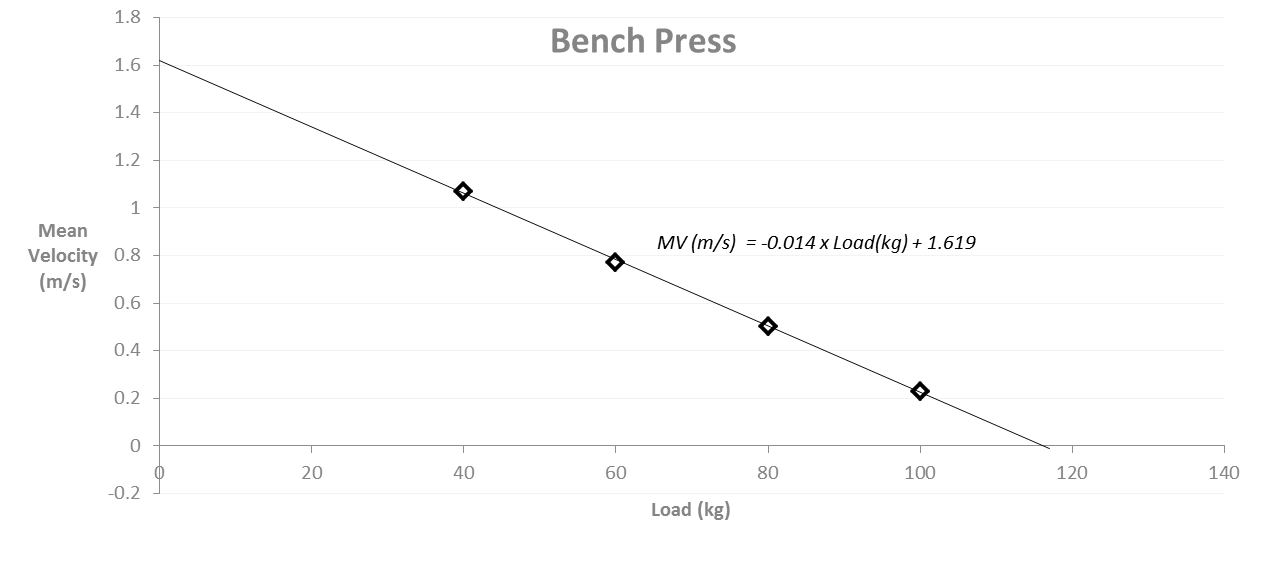
From the linear regression formula we calculate
LD0 = 115,64 kg
MV0 = 1,62 ms –1
Please note that LD0 is NOT my 1RM. The question is what is the velocity at 1RM attempt (for me)? I would say the 100kg pause bench (3’’ pause) was pretty tough already and the mean velocity was 0,19-0,23 ms –1.
As we know from the practice, some lifters have pretty fast 1RMs while others have slow 1RMs attempts („grinders“). I wonder why. It might be related to relative strength (for example 1RM of one lifter is 100% his bodyweight, while other might have 1RM of 180% his bodyweight), but even if this is taken into account people with same relative strength might differ how fast are they pushing in their 1RM attempt. Maybe it is CNS quality, fiber dominance, leverage, force curves and sticking point etc. It would be very interesting study to find out.
Back to my example. Mann 5 suggested the following zones:

I would call his absolute strength the ‘grinding zone’. For me, I might pull out 0,15 ms –1, so I might calculate how much would that be in kg.
1RM (Load @ 0,15 ms –1) = 104.92 or 105kg.
Nothing to be proud off though. Remember that this was a pause bench, with no spotters and not psyching up. (Note to myself – stop using the excuses and get back to work). If I assume that this is my 1RM, I can now calculate weights that could/should be used for development of different strength qualities (see Mann’s table)

This approach is novelty for me (and I guess to a lot of strength and conditioning coaches out there as well to power and strength athletes too) since before easily accessible LPTs like PowerTool/GymAware we haven’t even consider velocity as variable. This provides one whole another dimension to strength training programming, prescription and monitoring. I will expand more on this idea later. Let’s check out my squat performance.
Squat
Finally something I could be proud of – at least by formulas.
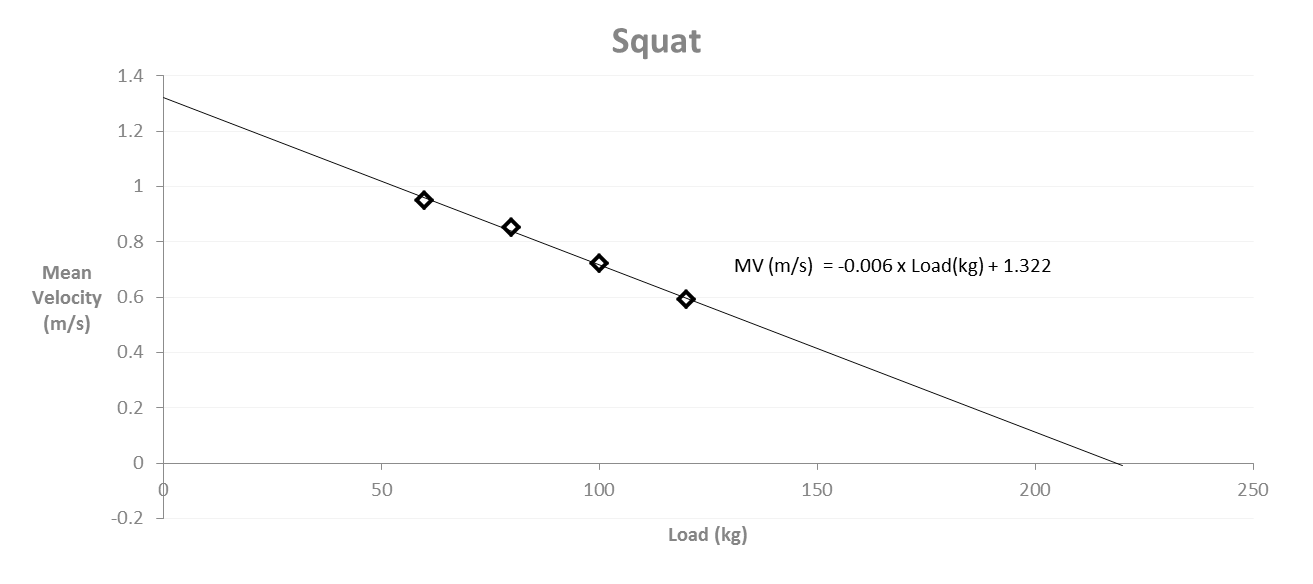
Although Jidovtseff et al. (1) recommends that the velocity difference between lightest and heaviest load should be more than 0,5 ms-1 for more precise linear regression, in my case the difference is 0,36 ms-1 (0,95 @60kg – 0,59 @120kg). I should have done one more set with 140kg to make regression formula more precise.
Anyway, now we can calculate
LD0 = 220,3 kg
MV0 = 1,322 ms –1
Same as with the bench press example I would need to know my 1RM velocity to calculate 1RM load. These differ between exercises . Something is telling me that velocity at 1RM attempt in squat is higher than 1RM attempt in bench press (due longer path?). For the sake of example I will use 0,25 ms –1
1RM (Load @ 0,25 ms –1) = 178,66 kg
If I plug this into Mann’s velocity categories this is what we get:

Novel Method – Using Velocity instead/together with 1RM or LD0
What I like with this method of calculating 1RM is that you don’t need to do 1RM attempt and you can actually prescribe load in form of load at certain velocity. For example – perform 2 reps at load that corresponds with 0,3 ms-1, or you can track load at 0,5 ms-1 over time instead or 1RM or 3-5RM. Of even better you can prescribe training intensities not on 1RM but rather at some decent velocity that is close to 1RM (1RM = Load @0,25 ms-1).
This is also interesting especially in power sports and/or mixed sports (like team sports and sport games) where we need to evaluate strength with good technique and speed, instead of grinding efforts. I would be more interested to see strength performance at certain velocity of the bar, instead of grinding attempts which could also have higher injury potential and can cause a lot of soreness the next day.
For this reason I think strength-velocity profiling might be a great idea. The question is how to use it to prescribe training loads, instead of only tracking 1RMs and/or strength at certain velocity.
First method which everyone is familiar with is to use 1RMs to prescribe training intensities. There is couple of ways of estimating 1RM:
- Actually measuring 1RM by 1RM testing
- Estimating 1RM from repetitions to failure (strength-endurance relationship)
- Estimating 1RM from load-velocity relationship (just described)
It can be said that reaching of the different strength training goals (and thus motor qualities) is based on utilization of different loading protocols (weight, reps, sets, tempo, rest, etc.) or methods. So, each of the methods aimed at reaching different strength training goal utilize different loading protocols. This is based on the repetition continuum, or the ’idea’ that different goals can be achieved utilizing different reps per set.
There is a dynamic interaction between the variables of reps, sets and loads. The load used (% of 1RM) ultimately determines how many reps per set are done. Reps per set (or set time) ultimately determines how many total sets must be done. The interaction between the three will affect what adaptation is seen. Although not all authorities agree, there is thought to be a continuum of adaptations which may occur with different repetition sets. This continuum is called repetition continuum and it is based on percentage of 1RM.
Example of using this continuum might be doing sets with 60-85% 1RM for hypertrophy and 85-100% for strength development, although this is a little oversimplification (please make sure to check Lyle McDonalds Categories of Weight Training or mine Planning the Strength Training). There are a lot of tables that prescribe optimal intensity, reps and volume (like Prilepin, Sheiko, etc) for reaching goals in maximum strength, strength-speed, speed-strength, hypertrophy, strength endurance, etc., so I will not cover them here.
What is common with all this methods is that they use 1RM (or %s of 1RM) for prescribing load. If I apply this approach to my bench press data this is what I get:
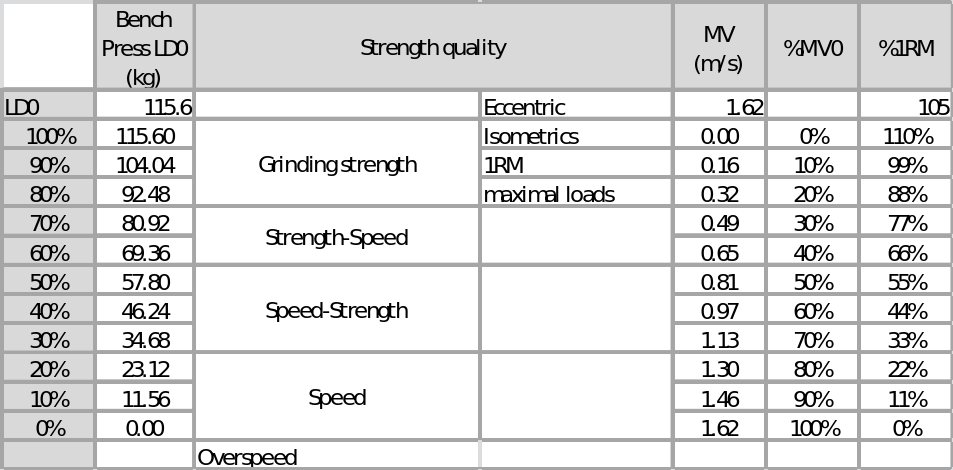
As you can see we can use % of LD0 and/or 1RM to prescribe training zones. Using linear regression formula I can easily find velocities associated with each zone (in my case for the pause bench press) which I can use as regulator of training – or in other words I can modify the training if I am tired and out of zone, or if I show improvements I could re-test the strength-velocity profile and prescribe new loads.
According to González-Badillo et al. 3 is your velocity at given load (in kg) improve for more than 0,07 – 0,09 ms-1 that corresponds to your 1RM improving for 5%. This again depend on the lifter, but it is a good baseline.
Using velocity in this way, one could stay with the certain weight until he masters it (and it this case that means improving average velocity of the lift). This shouldn’t be seen as a platoue, but rather training load at which you try to improve you power output.
What might be interesting novel method is to use velocity to prescribe loads. For example, one might use percentages of MV0 (estimated velocity when resistance is zero) or using velocity at 1RM. Check the following table where I used percentages of MV0 to create zones of intensity:
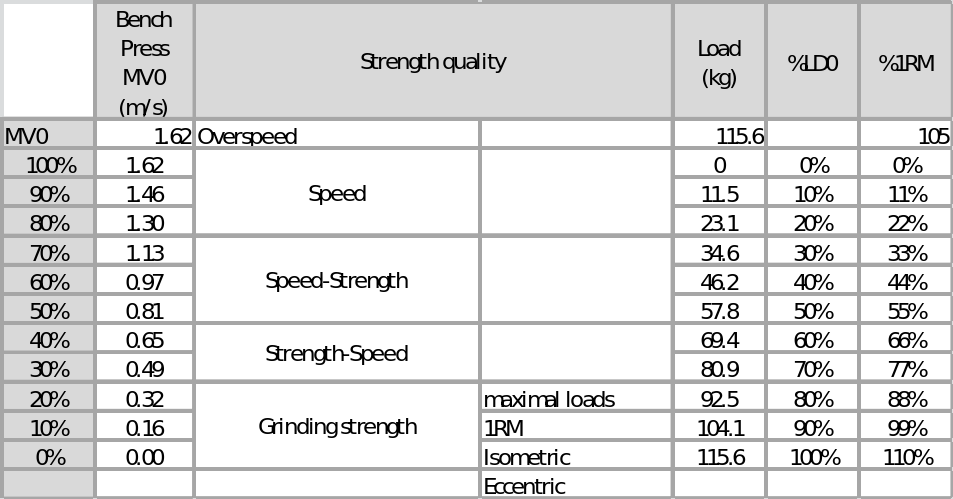
It is basically the same table as above, but I have using MV0 instead of LD0 to devise zones. Another interesting idea might be to use percentage of velocity at 1RMs to prescribe training load. Having velocity variable increase our option (and that sometimes confuses more than it gives freedom though).
I hope that in some future instalments I might give more precise instructions on how to prescribe training, monitor/regulate and progress over time using these variables. Till that time get the GymAware and start experimenting.
References
- 1Jidovtseff, B, Harris, NK, Crielaard, J-M, and Cronin, JB. Using the load-velocity relationship for 1RM prediction. J Strength Cond Res 25(1): 267-270, 2011
- 2Bosquet , L, Porta-Benache, J, and Blais, J. Validity of a commercial linear encoder to estimate bench press 1 rm from the force-velocity relationship. Journal of Sports Science and Medicine 9, 459 – 463. 2010.
- 3González-Badillo, J,J, Sánchez-Medina, L. Movement velocity as a measure of loading intensity in resistance training. Int J Sports Med (31): 347 – 352. 2010
- 4Jidovtseff, B, Cronin, J, Crielaard, J-M, Villaret, J, Harris, N. 1RM prediction and load-velocity relationship. From Book of Abstract: 8th International Conference on Strength Training. Oslo, 24th – 28th of October, 2012.
- 5Mann, B. Power and Bar Velocity Measuring Devices and their use for Autoregulation. NSCA Hot Topic series. Downloaded 1.11.2012 from http://www.nsca.com/WorkArea/DownloadAsset.aspx?id=707 [Available to NSCA Members Only]




Responses