Banister Impulse~Response model in R [part 2]
In the previous part I’ve introuced multivariate modeling of impulse and response using Banister model. In this part I will continue with exploration of this model, mainly visualizing reaction predicted by the model on standardize impulse (load) and compare prediction using multiple impulses. I will use same data sets: one by Skiba and one randomly generated as in first installment.
Let’s load the Skiba data and train the model and plot it’s performance on training data set.
library(lubridate)
# Load Banister functions
source("Banister Impulse Response Multivariate.R")
Skiba <- read.csv("SkibaIR.csv", header=TRUE)
Skiba$Date <- dmy(Skiba$Date)
Skiba <- Skiba[1:3]
Skiba$BikeScore[is.na(Skiba$BikeScore)] <- 0
skiba.model <- train.Banister(data=Skiba,
impulse="BikeScore",
response = "X5.min.Test.Power",
dates = Skiba$Date)
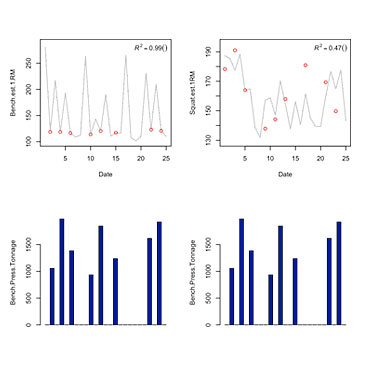
plot.banister(skiba.model)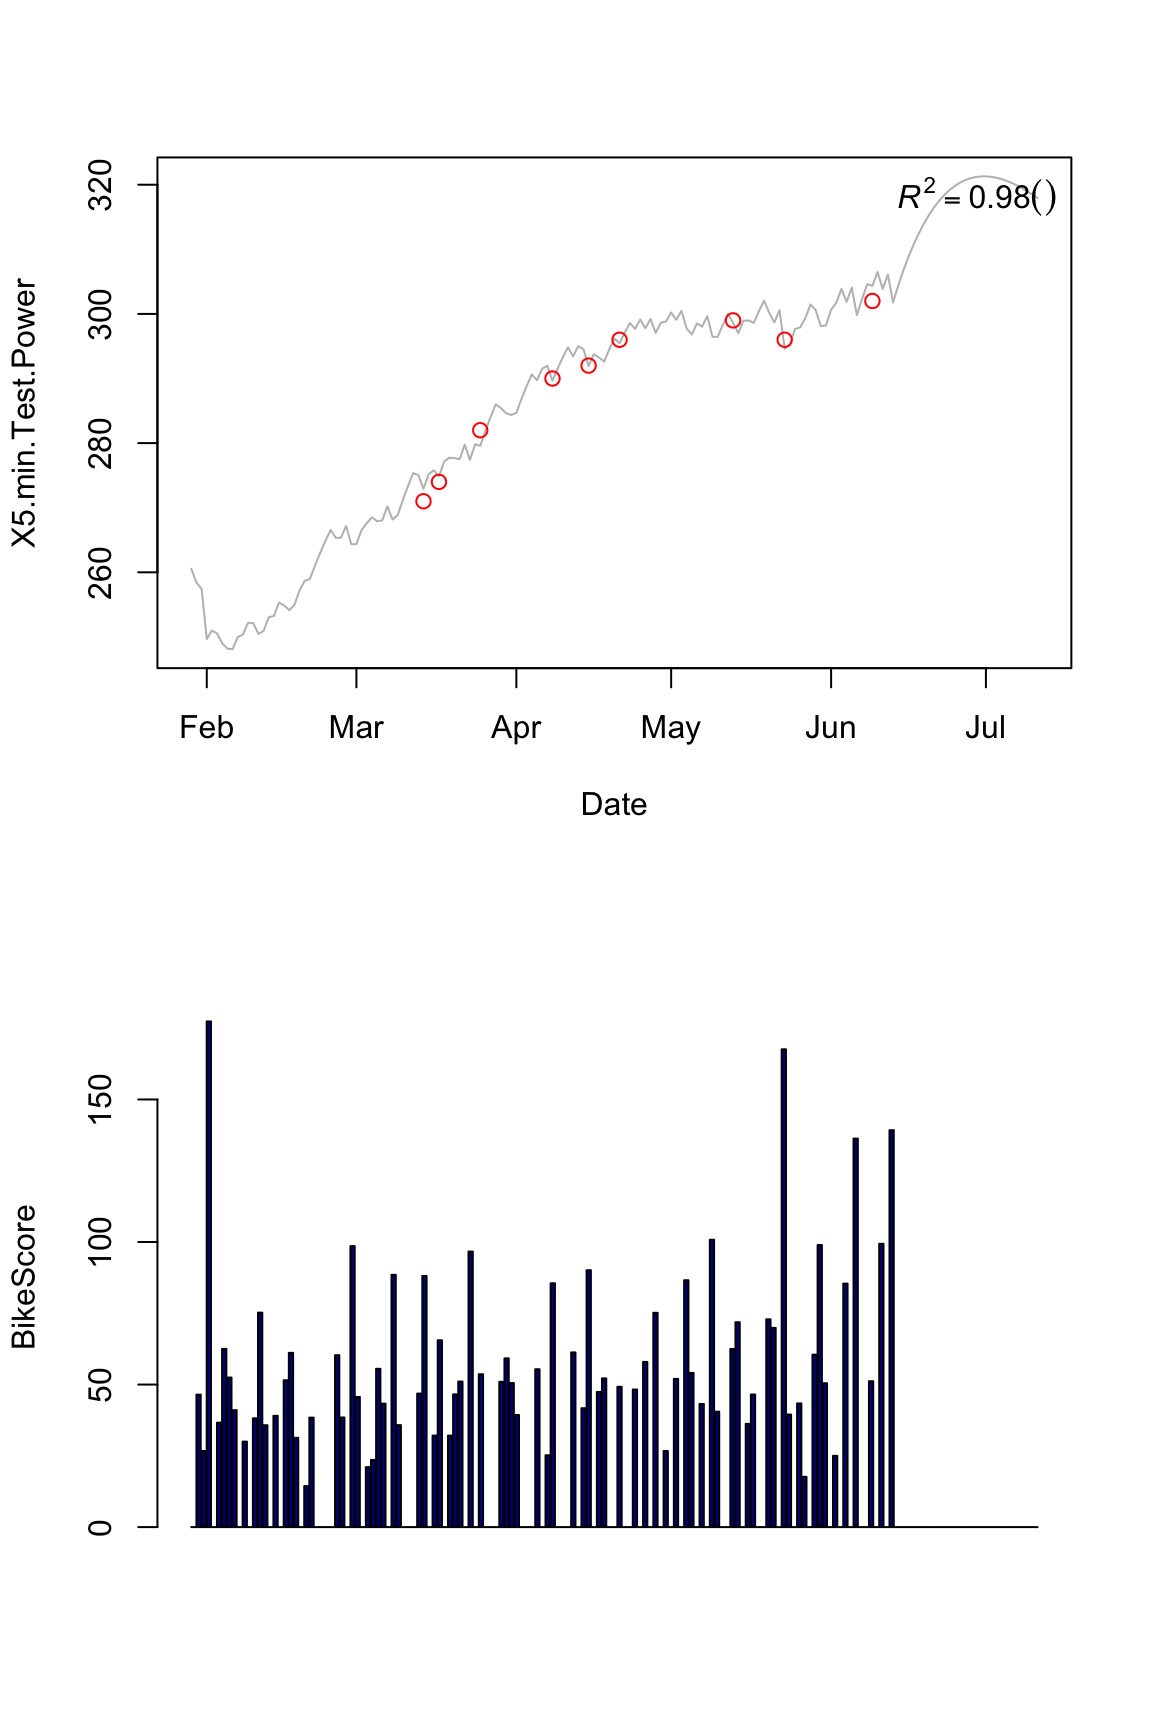
I have coded additional function to allow some some simple diagnostics of the model. For example, I am interested in how this athlete will react if I impose certain load on his, let’s say 100 units of Bike Score
plot.banister.diag(skiba.model, standard.impulse = function(x) {100})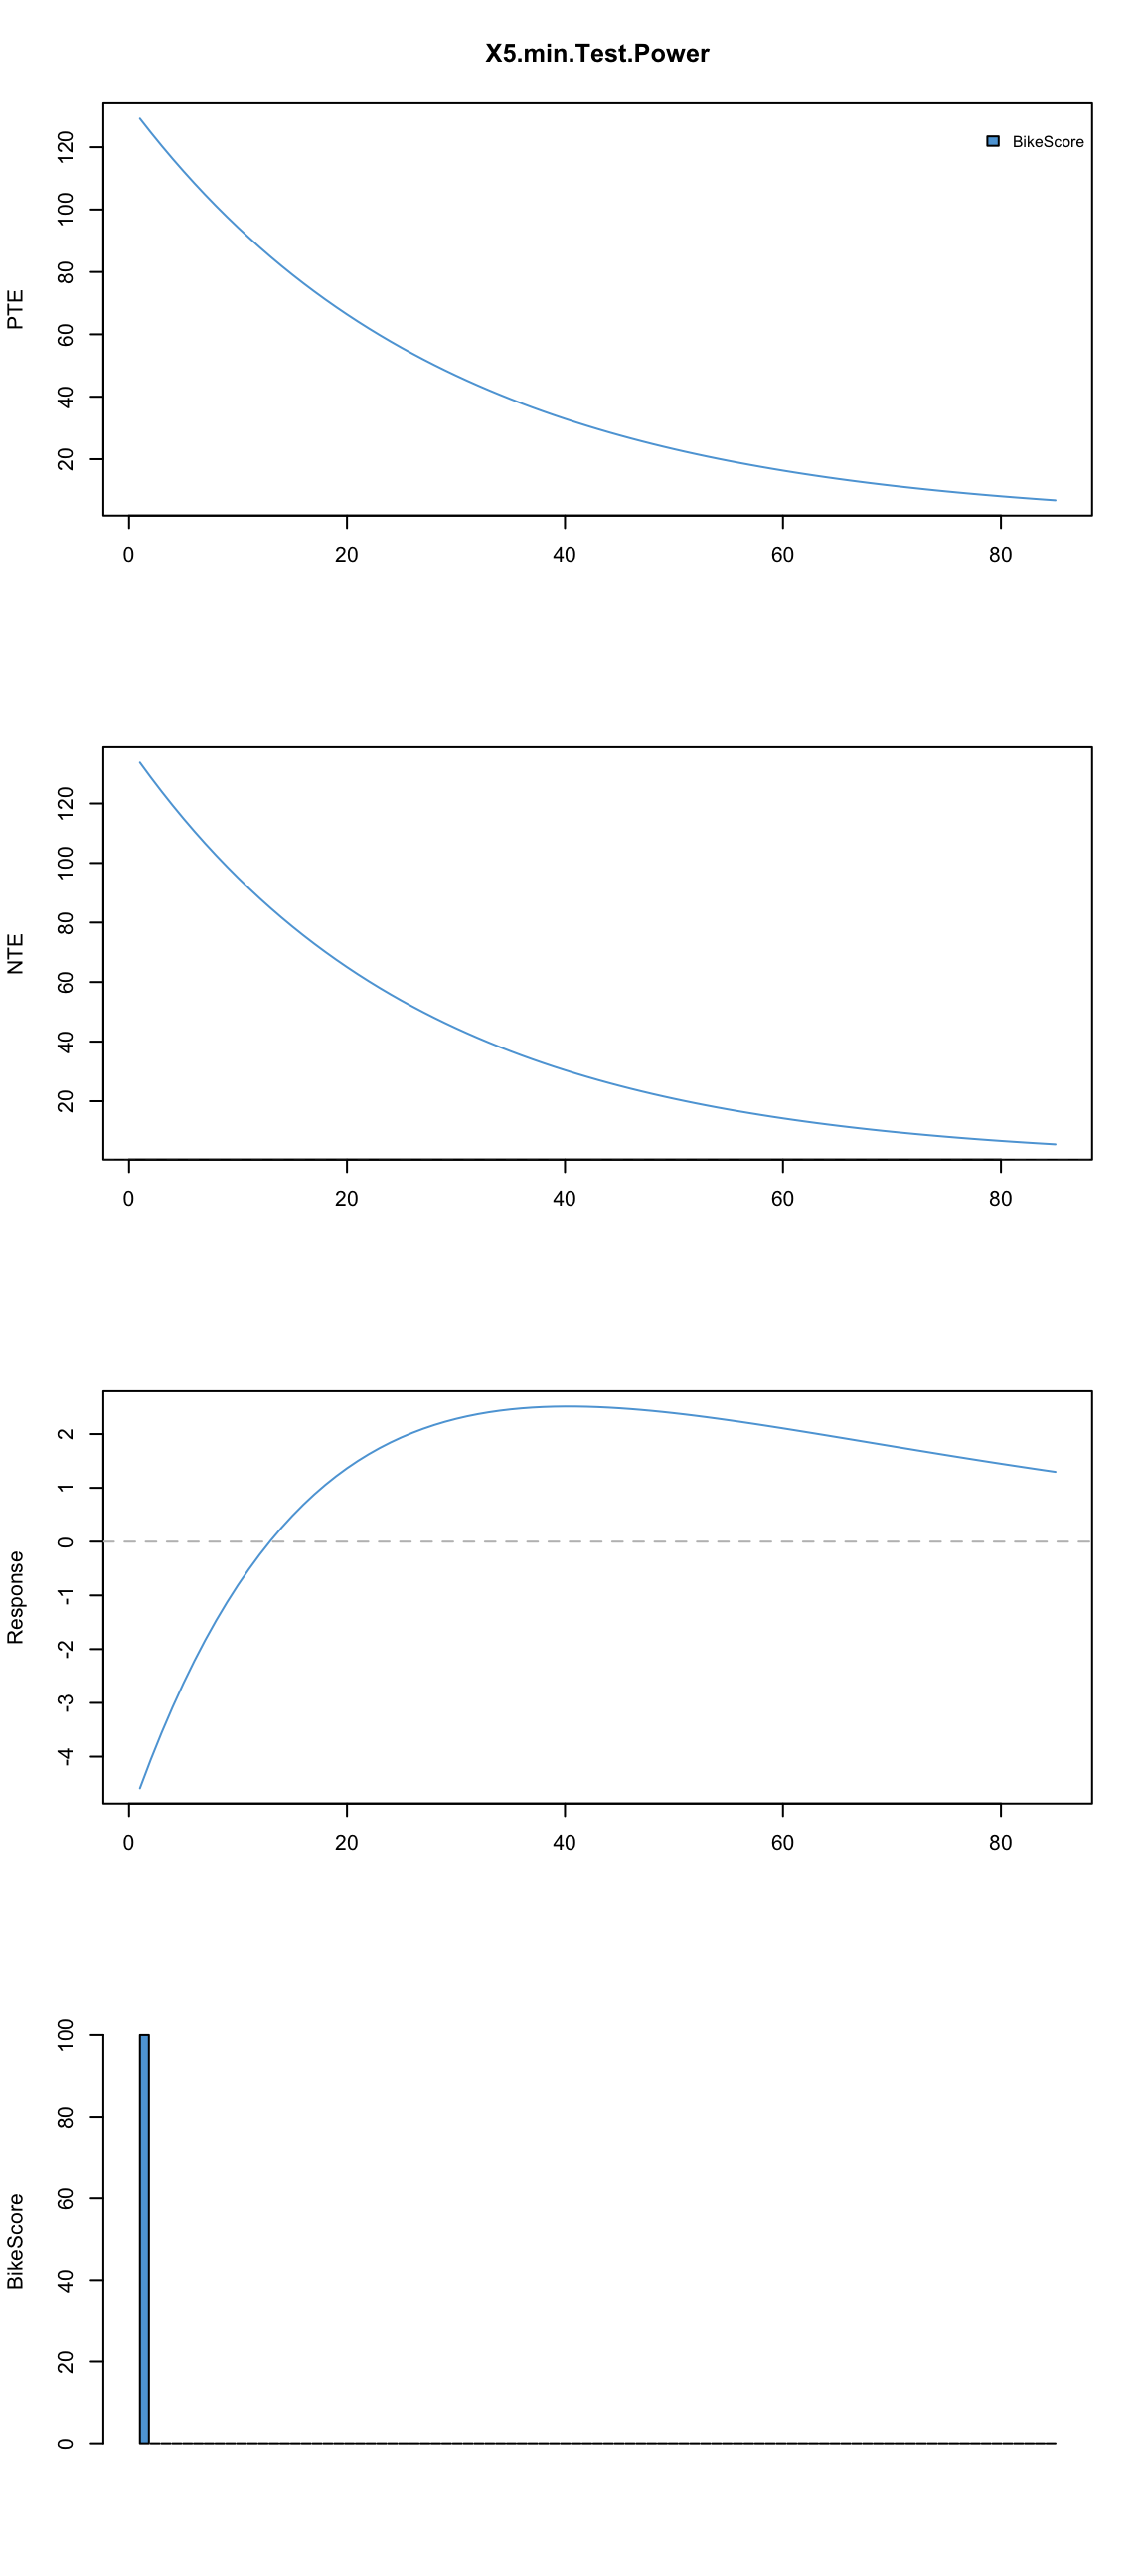
First plot is Positive Training Effect and second is Negative Training Effect. This plot is Response which is basicaly TPE – NTE assuming that p0 (starting performance) is equal to 0.
Bottom plot depicts impulse (or training load) in the bike score
As can be seen from the picture, single session of 100 units cause more fatigue (k2 > k1), but it lasts shorter (tau2 < taui1) hence we get that dip and supercompensation in the Response.
What if we repeat this 100s BikeScore points back to back for 10 days?
plot.banister.diag(skiba.model, standard.impulse = function(x) {100}, impulse.loc = 1:10)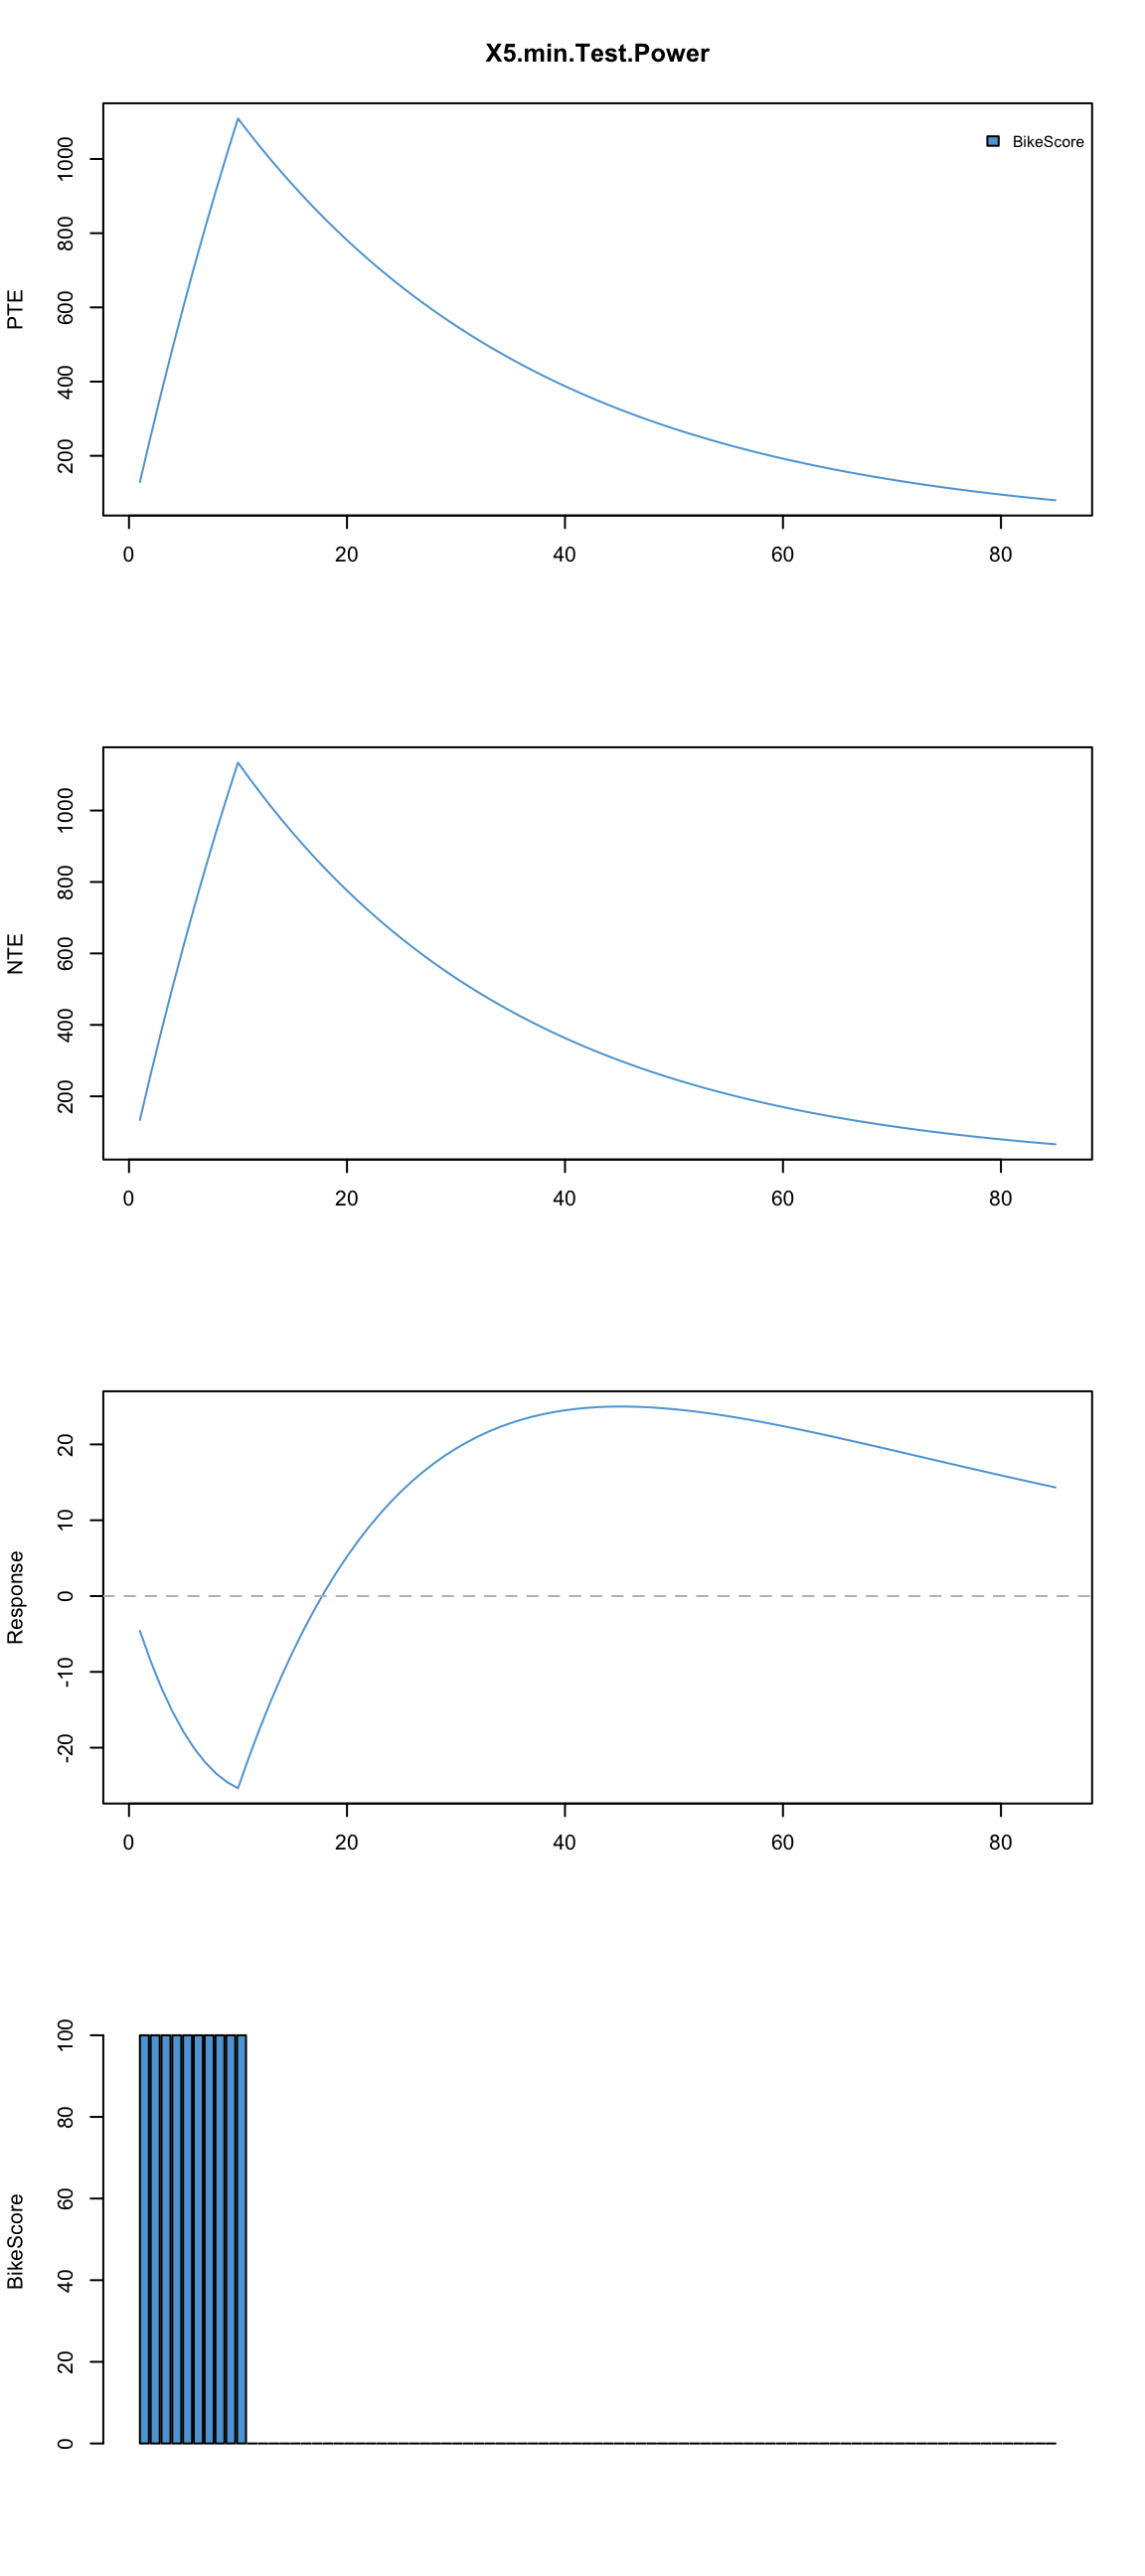
What if we evenly spread those 100s BikeScore points every 5th day?
plot.banister.diag(skiba.model, standard.impulse = function(x) {100}, impulse.loc = c(1,6,11,16,21,26,31,36,41,46))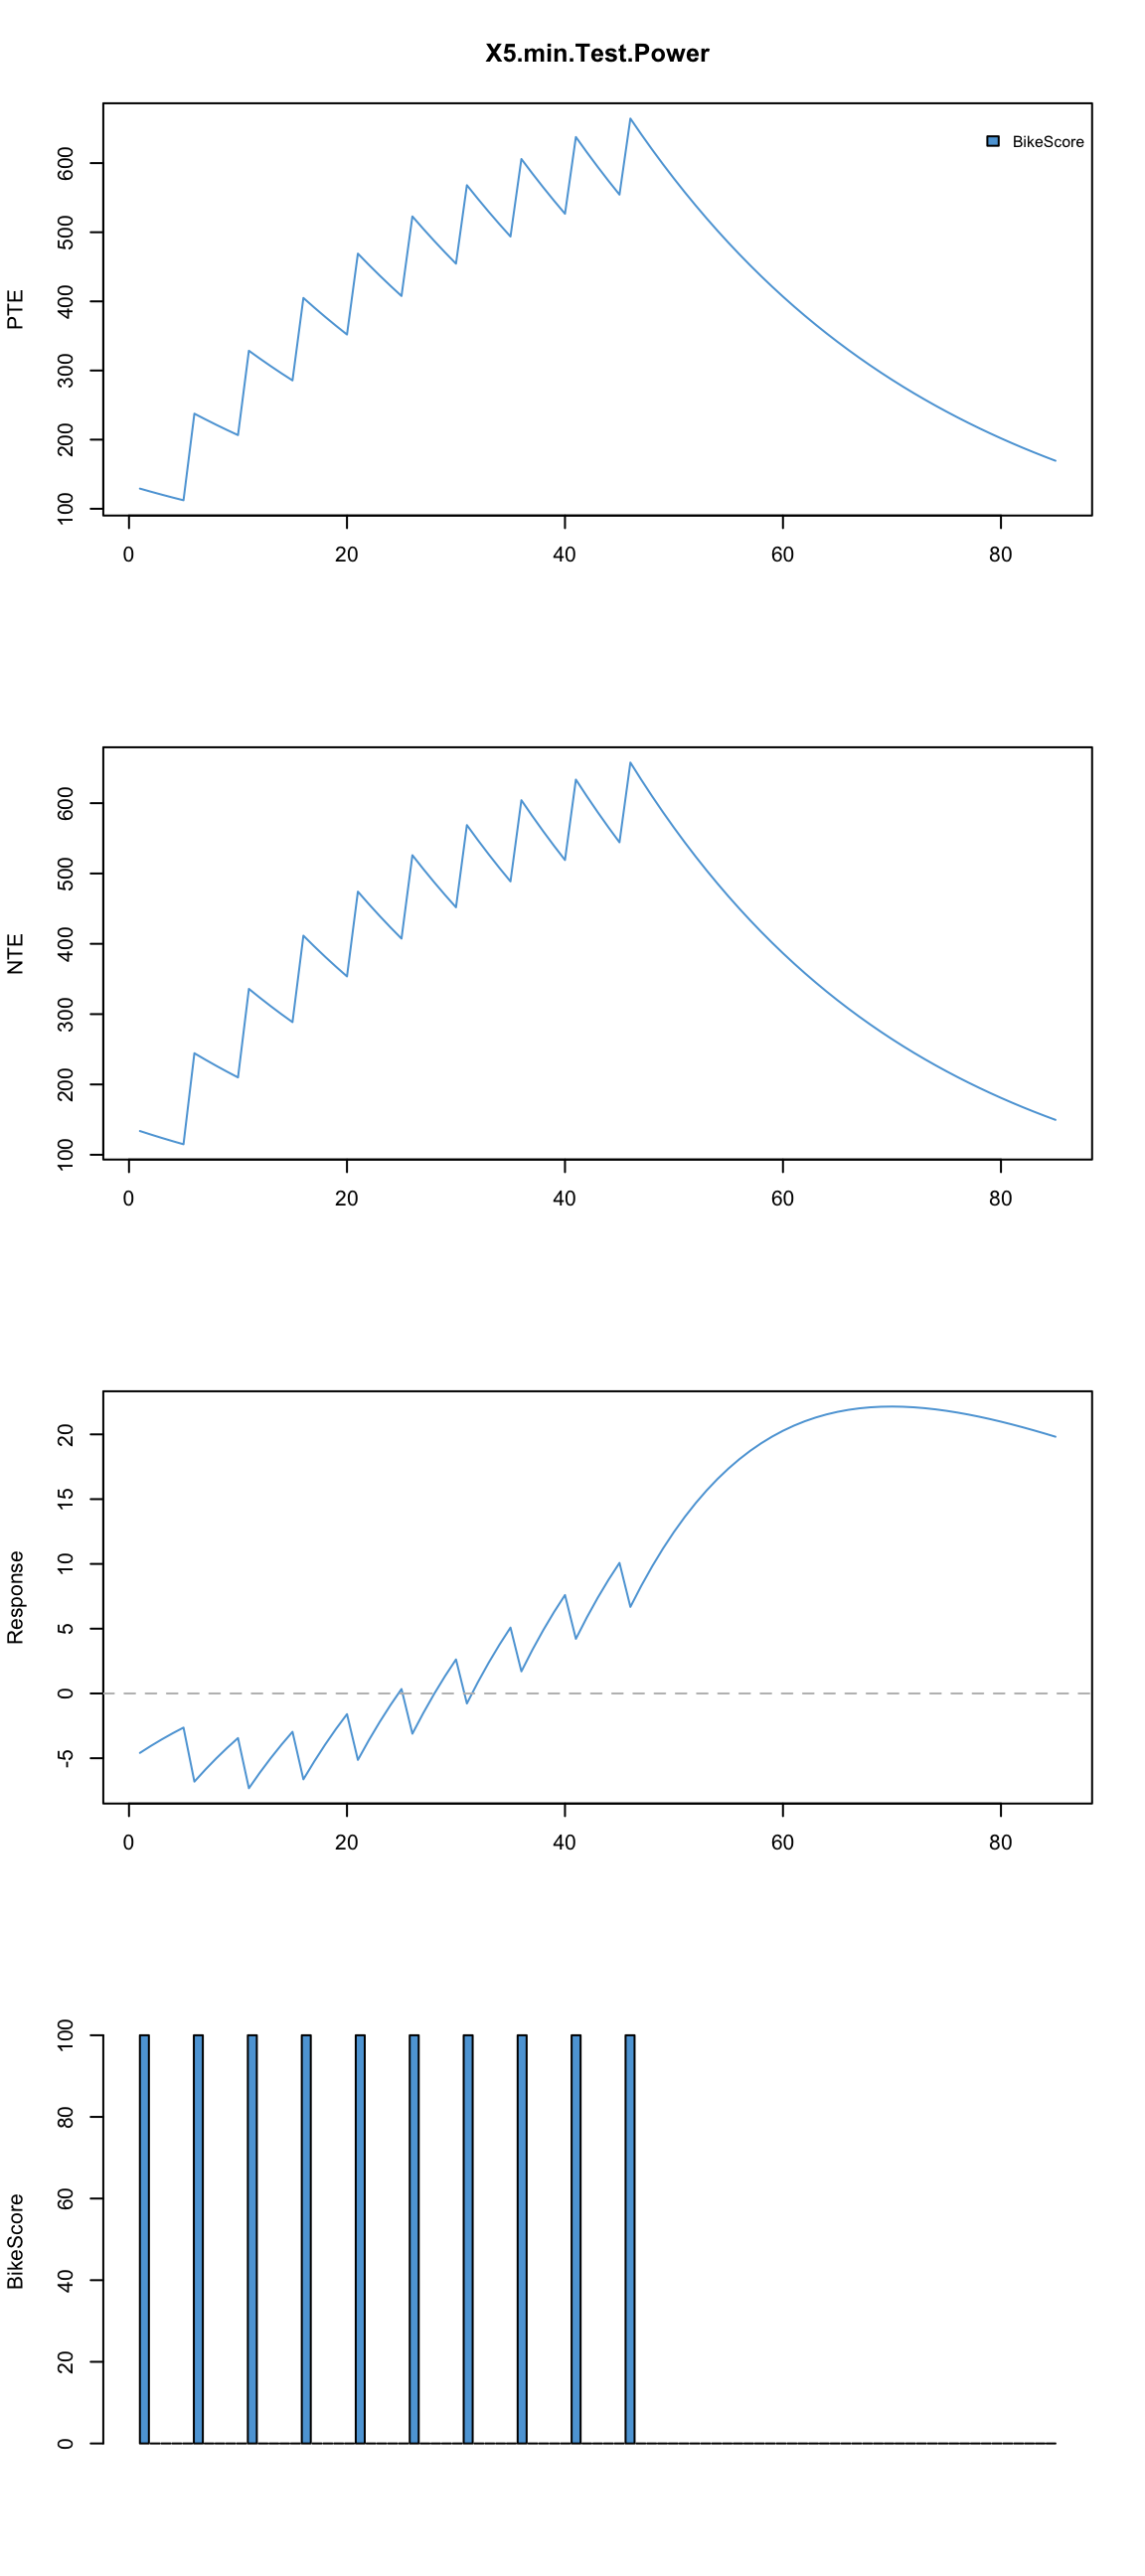
Or if we create blocks of two with 5 days of rest in between?
plot.banister.diag(skiba.model, standard.impulse = function(x) {100}, impulse.loc = c(1,2,8,9,15,16,22,23,29,30))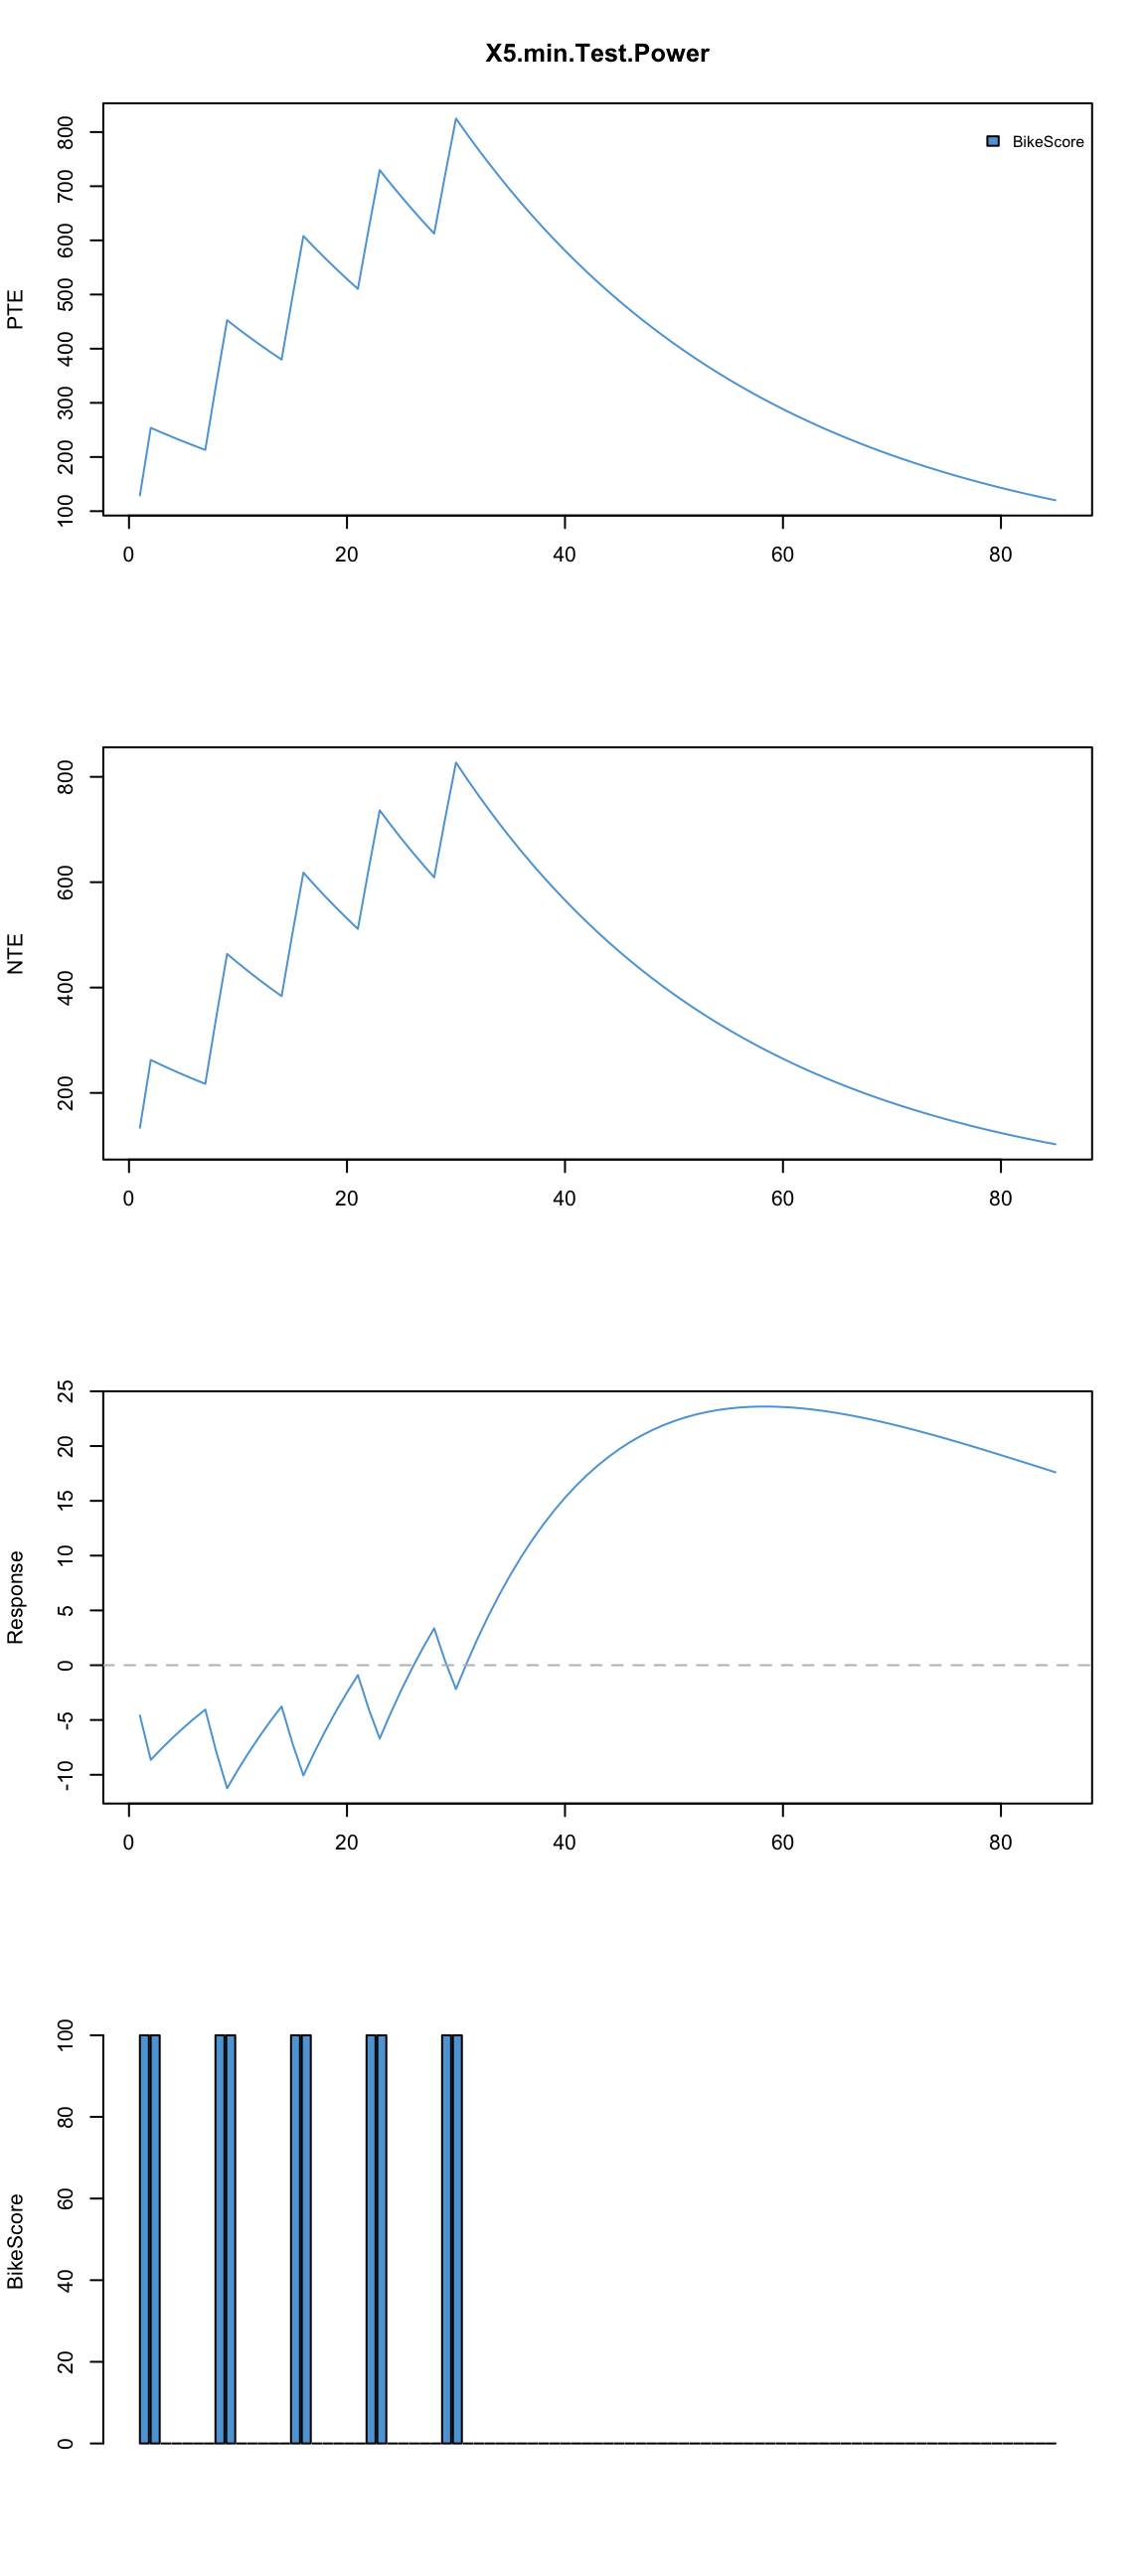
As can be seen we now know much more about how long it takes for someone to get out of the ‘hole’, how far one can reach and when depending on the training schedule/organization. Using this model we know approximately how long and how hard each phase should be for given athlete. Yes, there is complexity with the interaction of impulses and reactions, but this is a major step forward.
Let’s take out 1RM bench press random data
set.seed(21)

number.of.days <- 60
Date <- dmy("1/1/2014") + ddays(1:number.of.days)

# Generate RESPONSE variables
benchpress.1RM <- 100 + (1:number.of.days)/3 + runif(min=0, max=5, n=number.of.days)
benchpress.1RM[runif(min=1, max=60, n=number.of.days * 1.5)] <- NA # Add a lot of NAs

# Generate IMPULSE variables
benchpress.tonnage <-  runif(min=0, max=3000, n=number.of.days)
benchpress.tonnage[benchpress.tonnage<500] <- 0

squat.tonnage <-  runif(min=0, max=5000, n=number.of.days)
squat.tonnage[squat.tonnage<500] <- 0

# Put everything in training.data data frame
training.data <- data.frame(Date, benchpress.tonnage, squat.tonnage, benchpress.1RM)

model1 <- train.Banister(data=training.data,
               impulse=c("benchpress.tonnage"),
                response = c("benchpress.1RM"))

plot.banister(model1)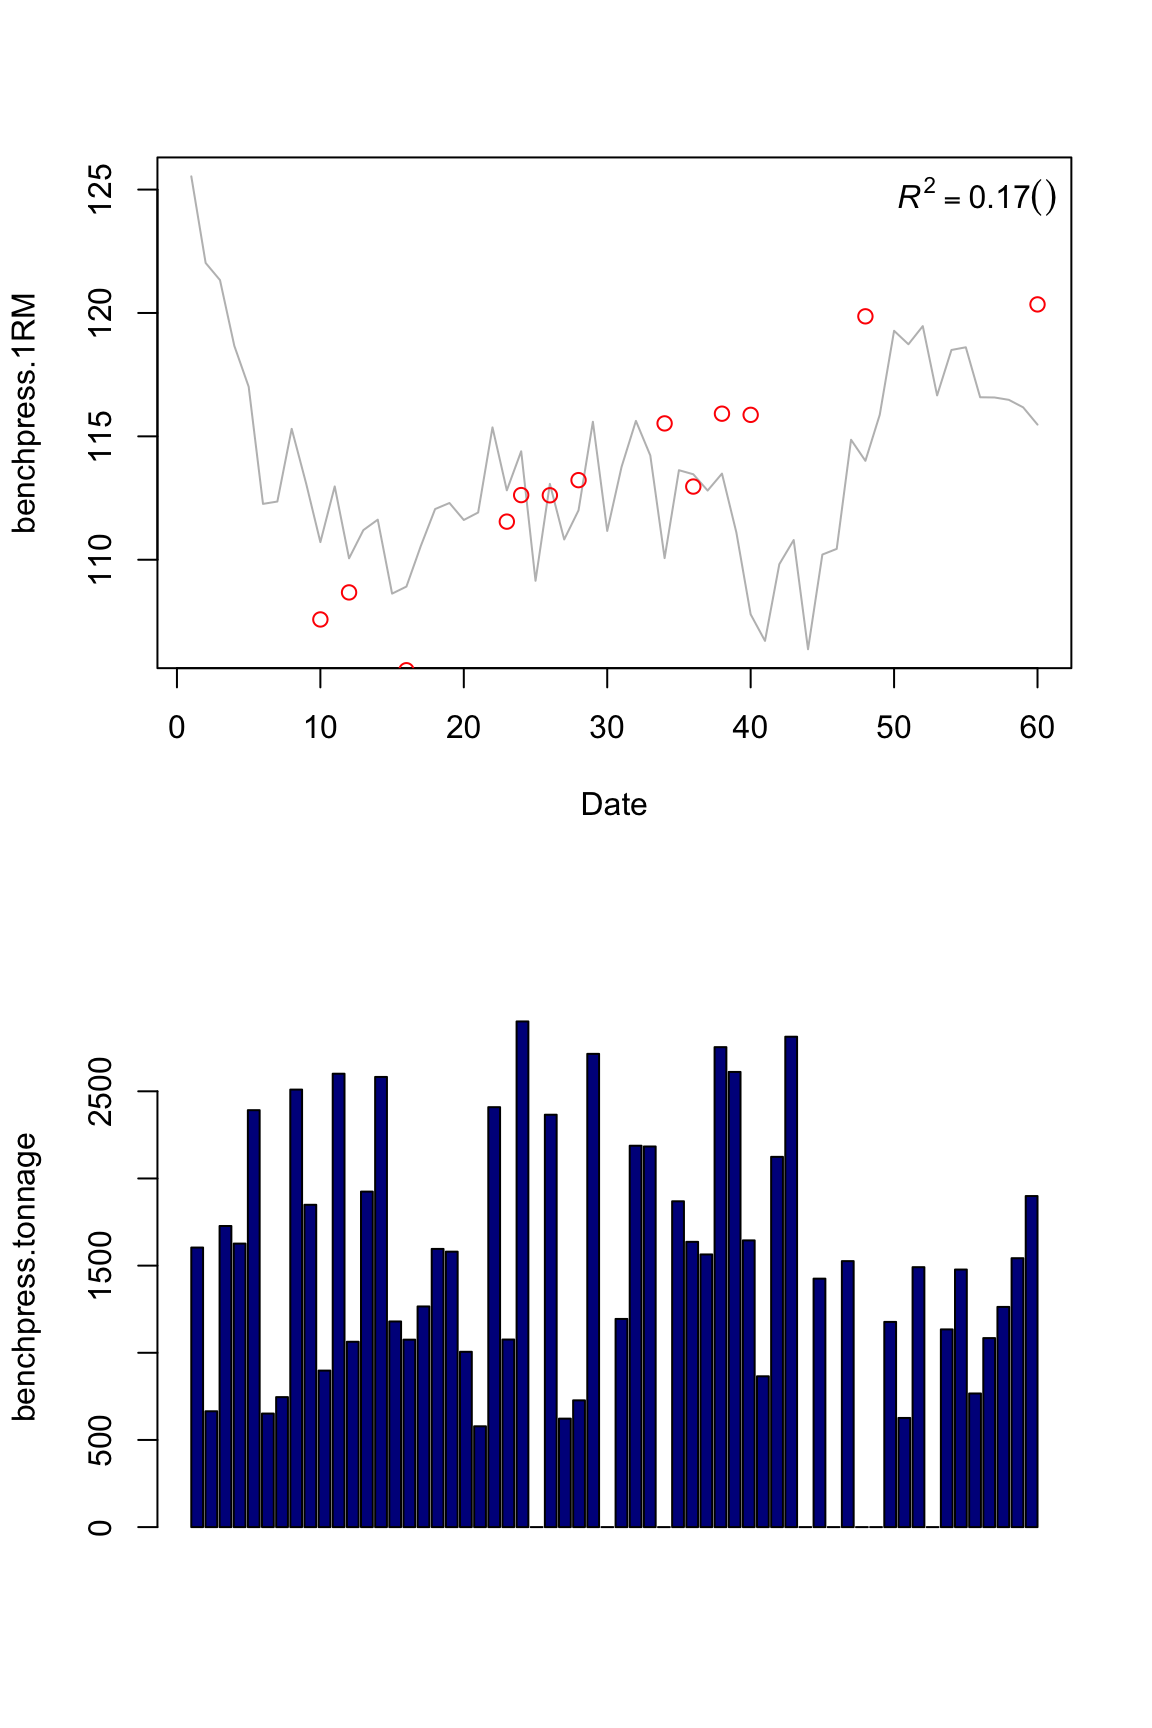
And we plot the diagnostics, but for the impulse we will use average of all bench press tonnage impulses applied instead of 100. This represent “typical”" workout
plot.banister.diag(model1, len = 50)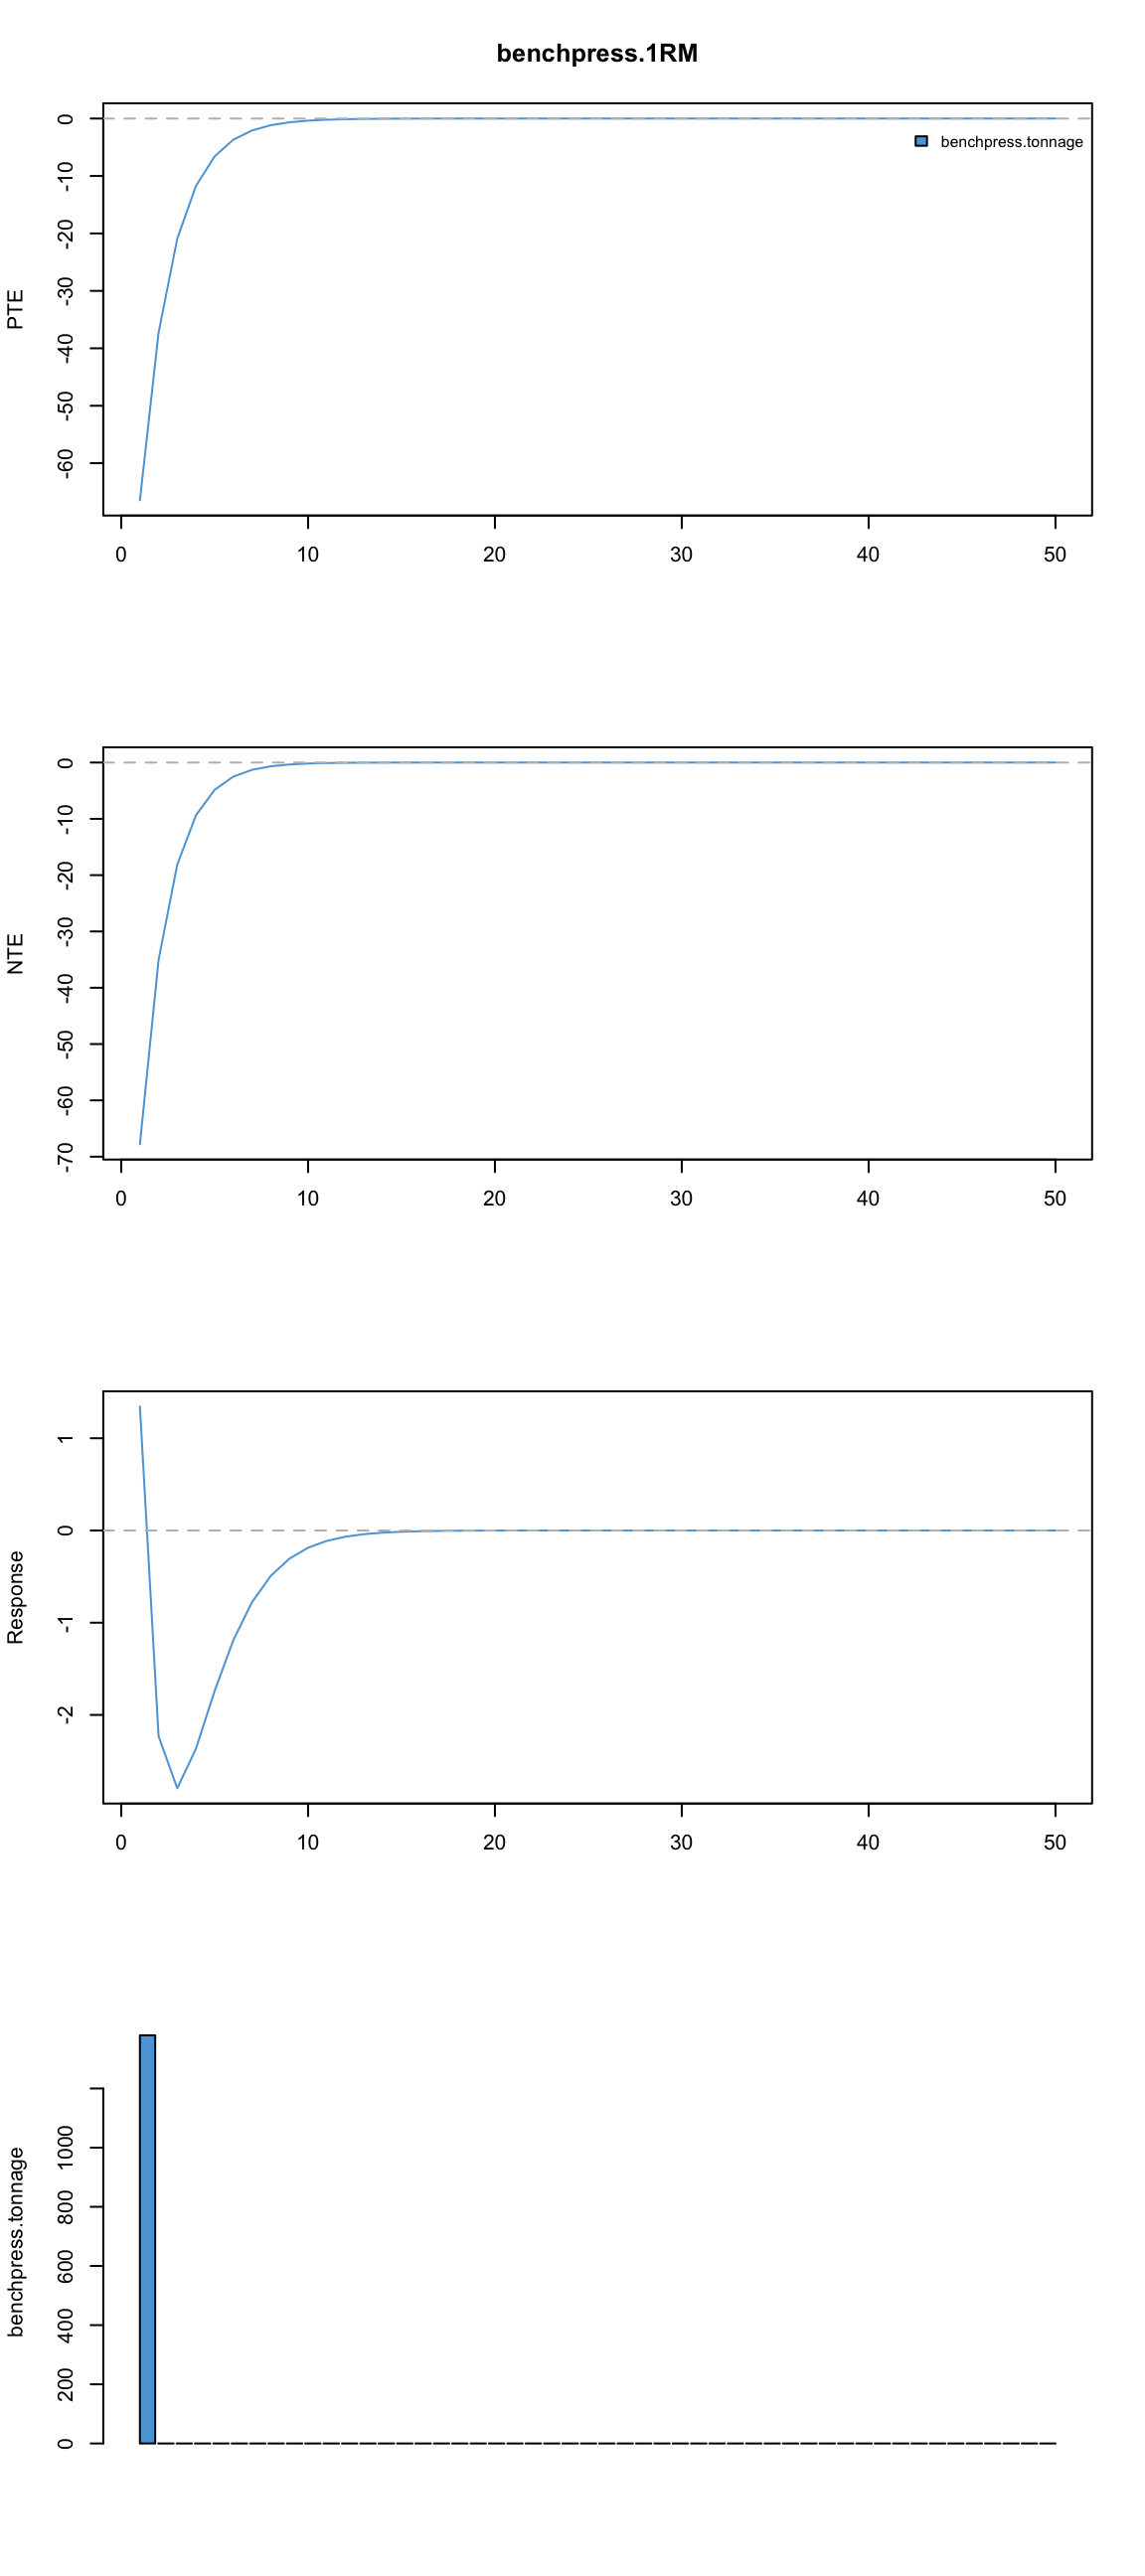
We got everything messed up. Part of the reason is that I still struggle to set up k1, tau1, k2 and tau2 constraints to the R optimizer function which can result in missing to find the optimal model parameters. Another part might be that Banister model cannot explain the relationship between bench tonnage and bench 1RM. Maybe we did something that affect our bench 1RM more than bench tonnage?
We have also done squat training, and that can affect our bench 1RM. Maybe squat tonnage have negative influence (transfer) on bench press 1RM or maybe positive? We need to train the model again and this time use ano more impulse variable: squat.tonnage
model2 <- train.Banister(data=training.data,
               impulse=c("benchpress.tonnage", "squat.tonnage"),
                response = c("benchpress.1RM"))

plot.banister(model2)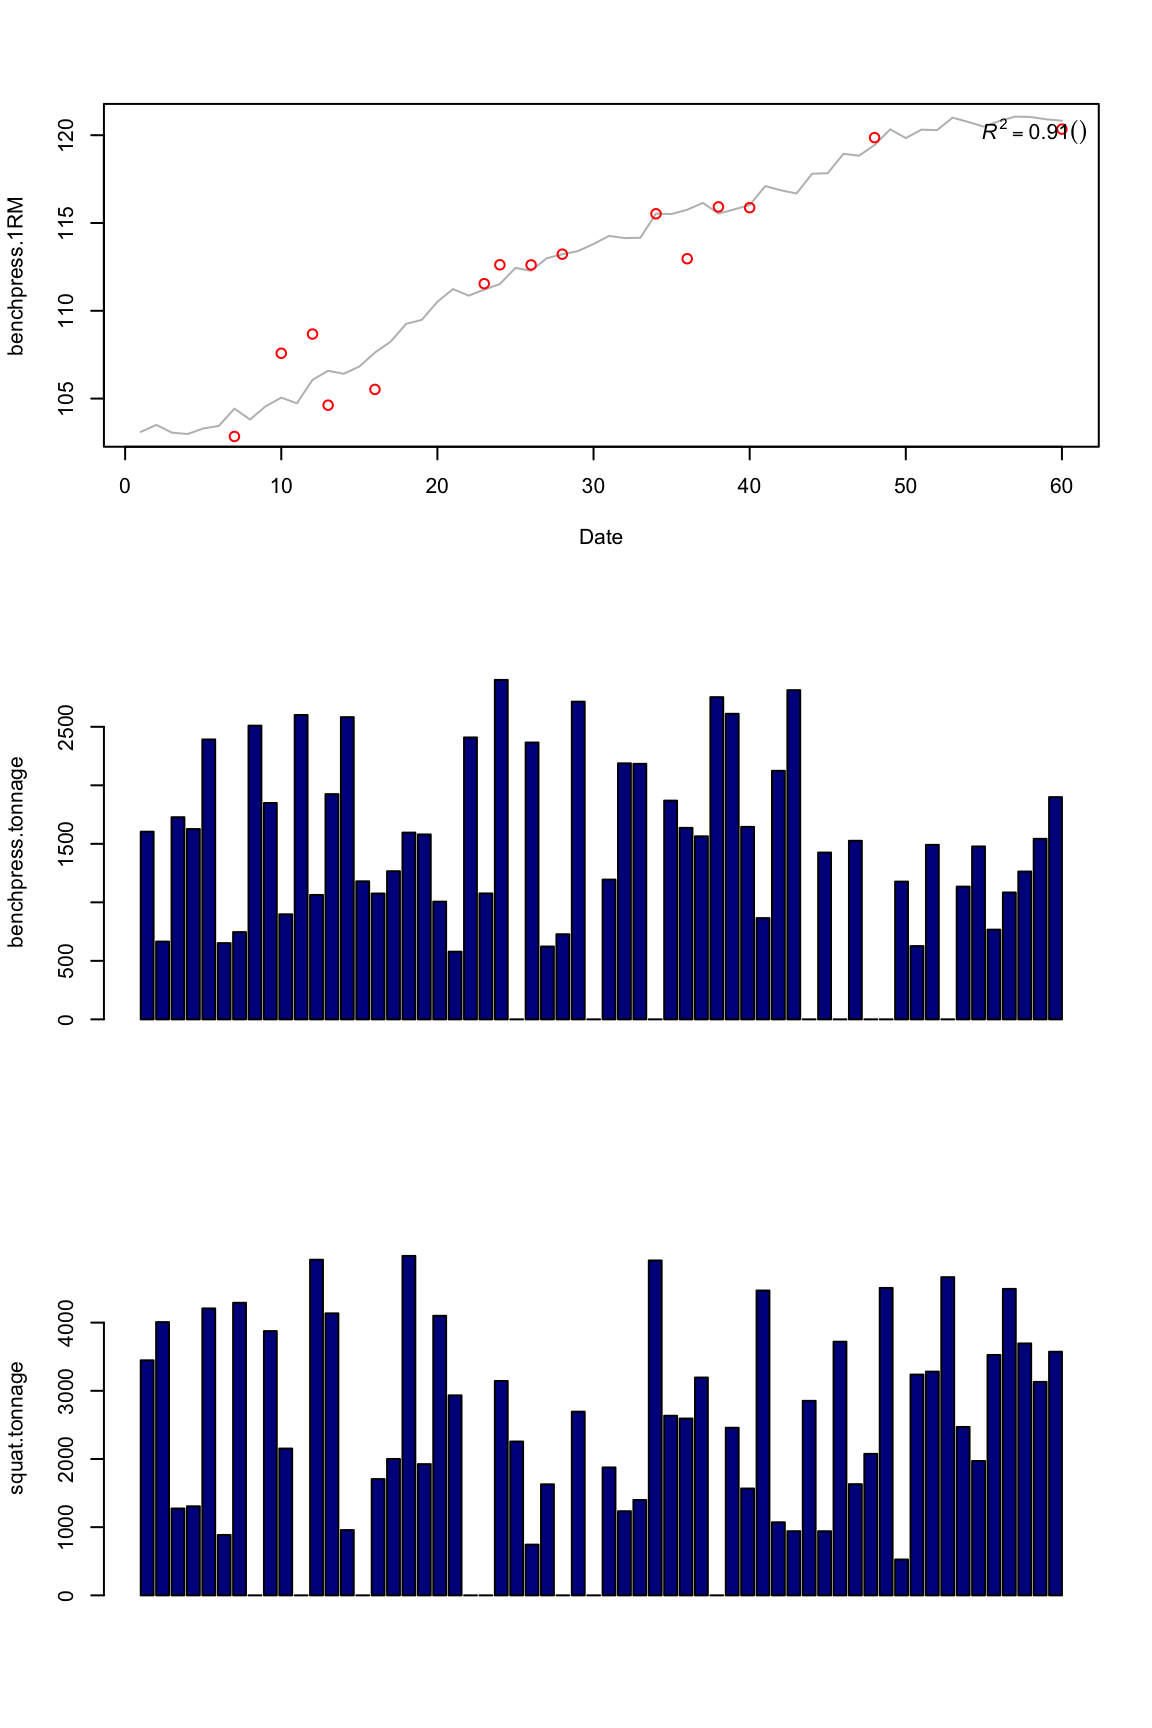
Now our model can explain much more variance in bench press 1RM.
We can plot the diagnostics and see how this athlete react on a standardized load. Beause we have now both bench and squat tonnage, we need to use something that is frequent in both, and thus we can use mean of tonnages as a typical stimulus of each.
It must be clear that on the following graph we calculate TPE, NPE and Response when we apply ONLY stimulus in one variable alone.In this case we can see how our 1RM responded if we applied typical bench tonnage or typical squat tonnage. This can be useful when figuring out what impulse variable positivelly or negativelly affects response variable
plot.banister.diag(model2)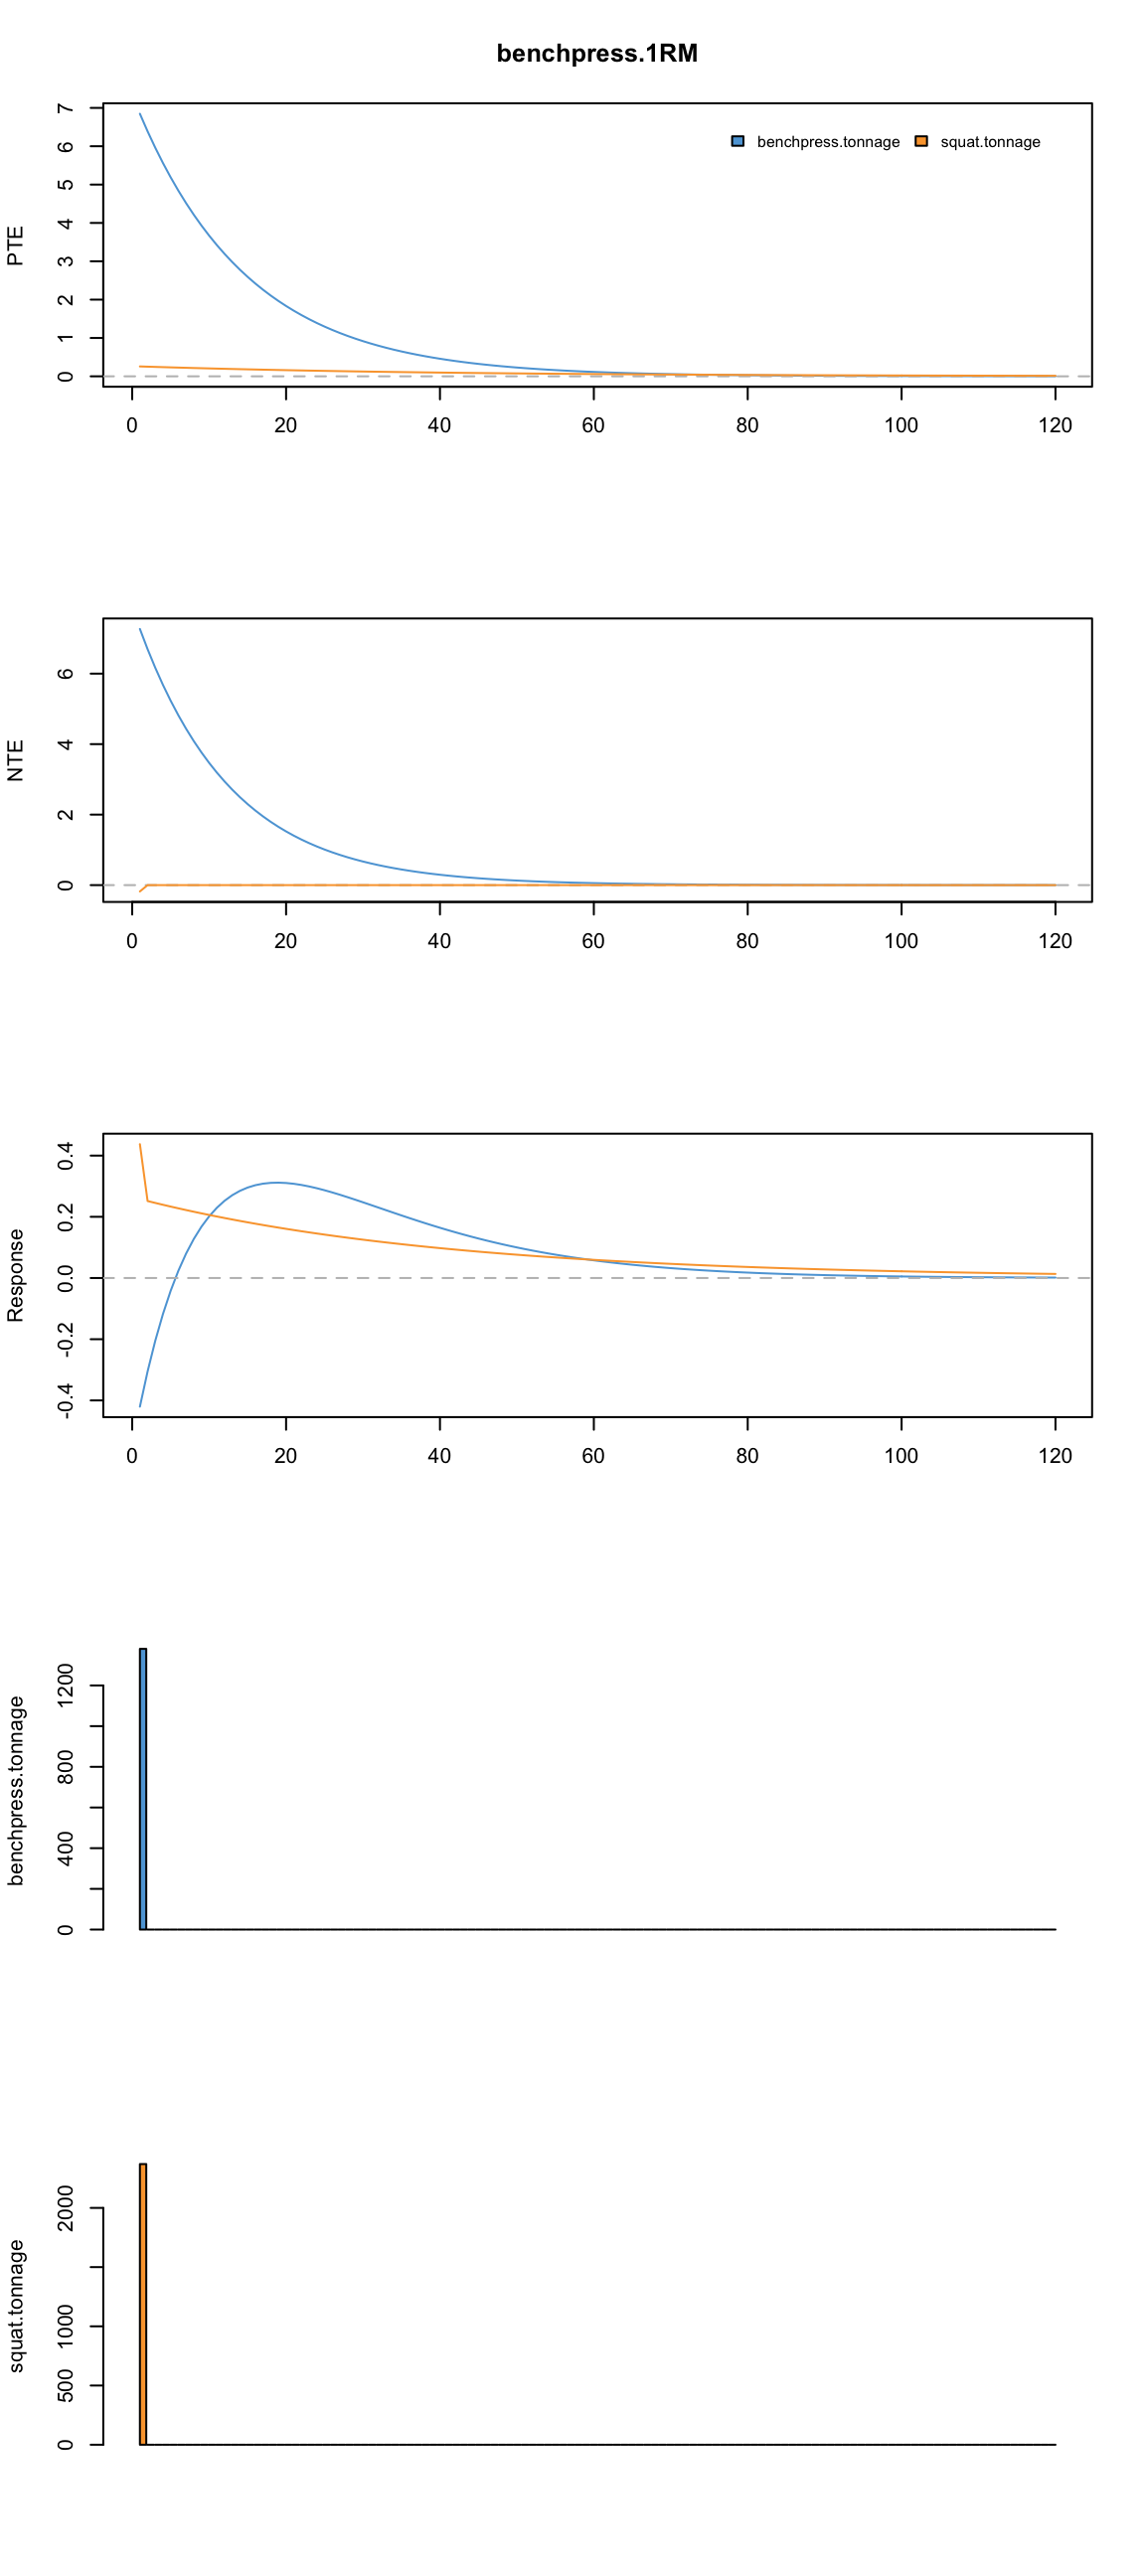
Let’s see what happens when we repeat 10 impulses
plot.banister.diag(model2, impulse.loc = 1:10)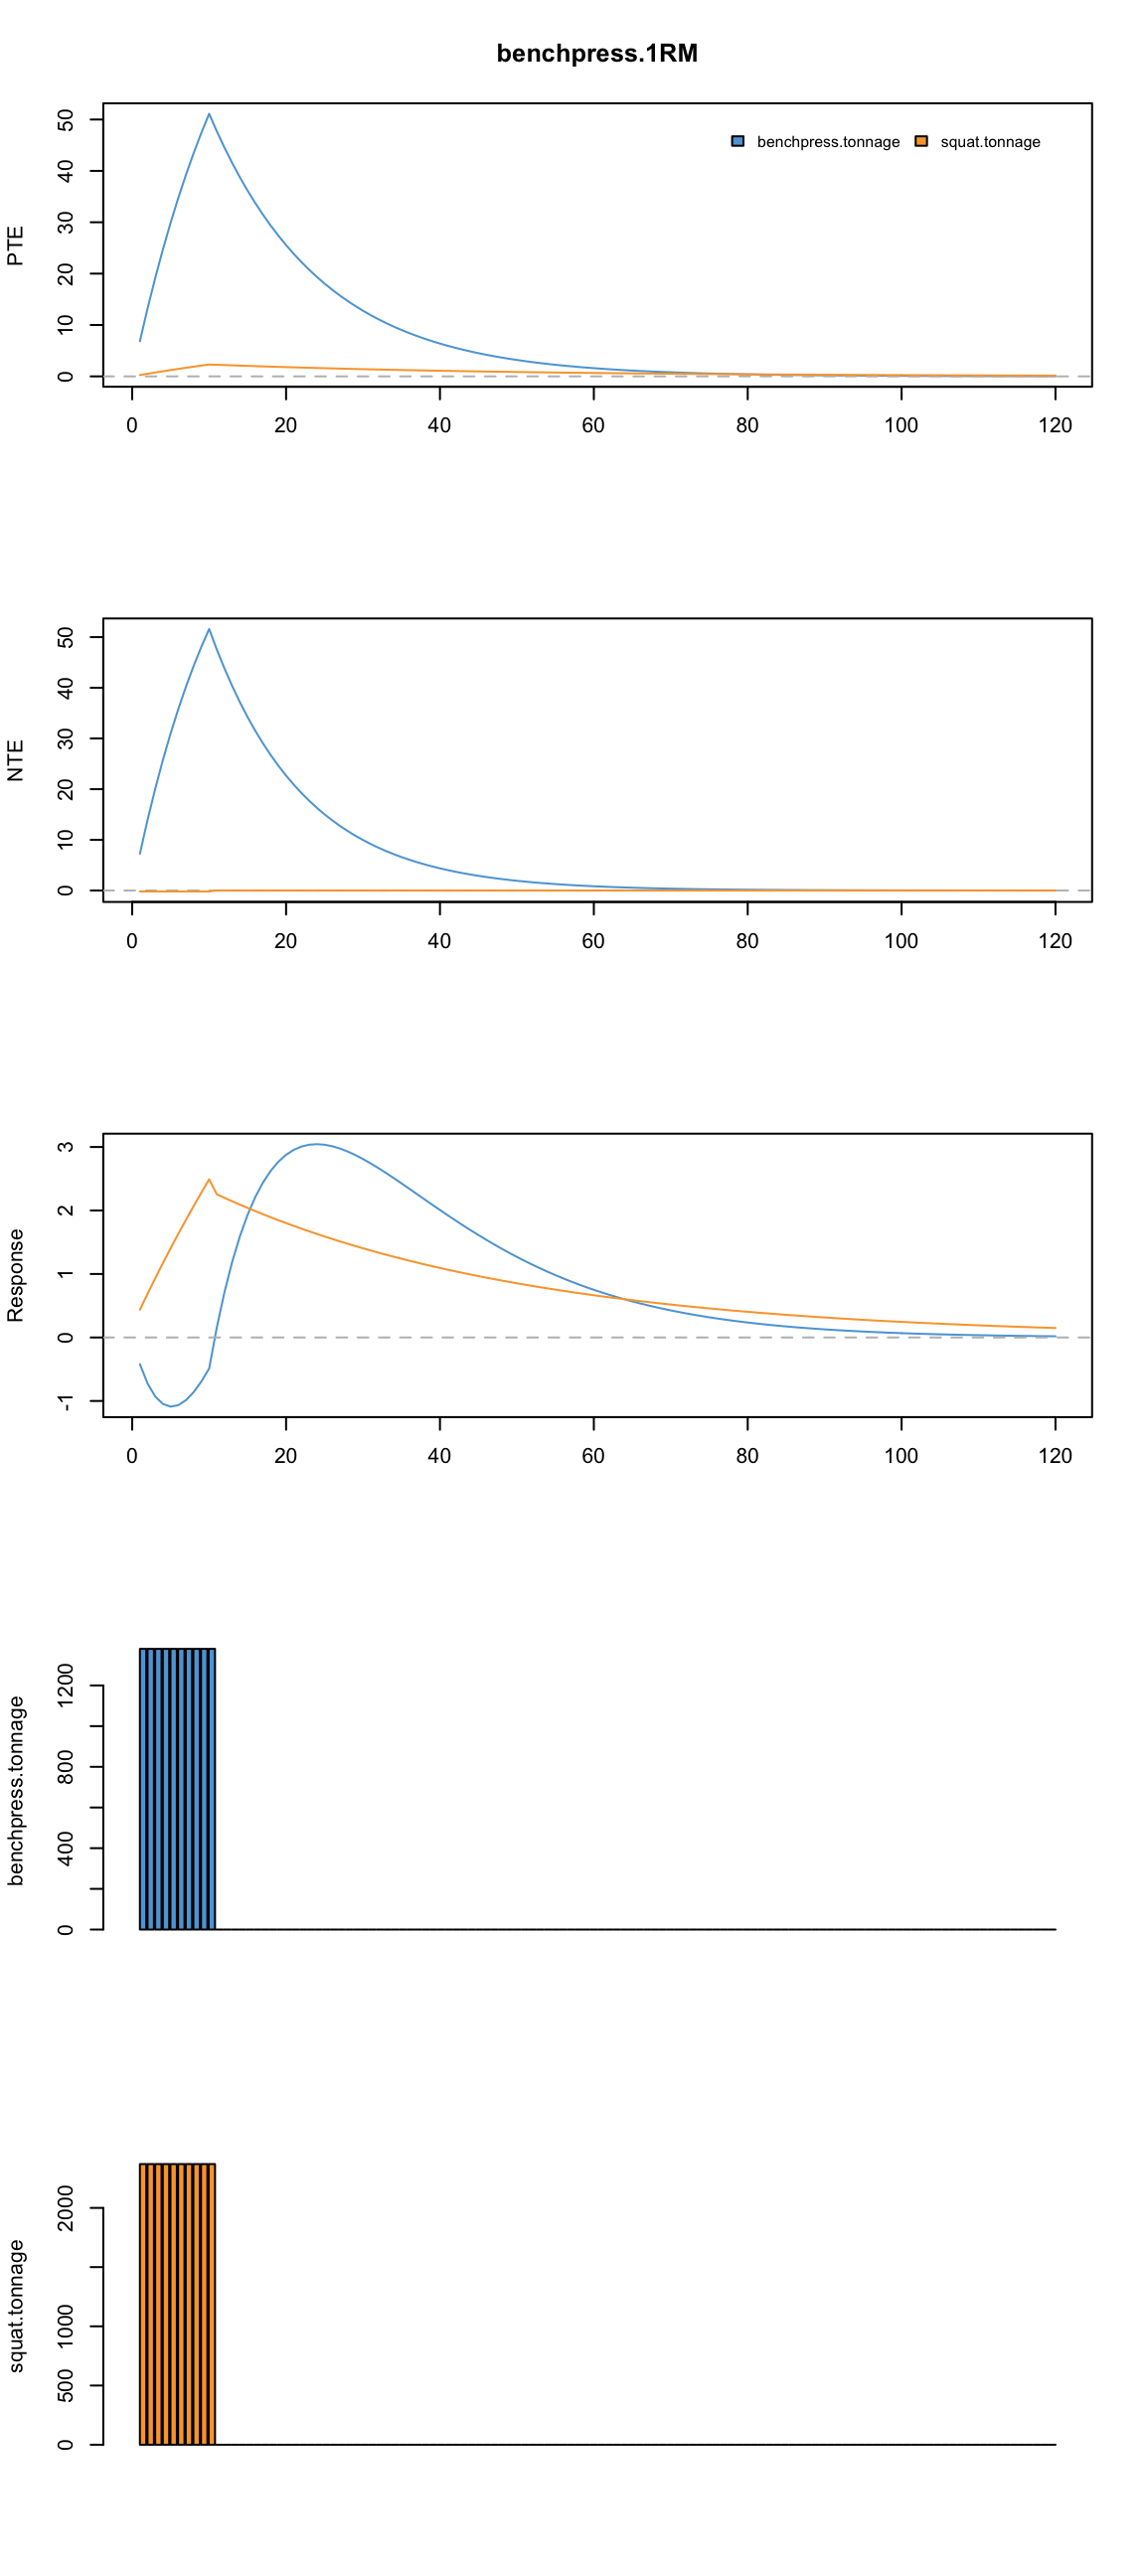
As can be seen from the picture it seems that in this model bench press tonnage appears much more informative. This is confusing, becauase we get more info from this variable in this model (when we have two impulses) then when we solely used that one. This can happen in modelling and I am not sure why did this happen now – maybe the single impulse model couldn’t find the best soulution? I need to check with someone wiser. And set constraints for optimizer so it doesn’t mess up TPE and NPE.
When we have two or more impulse variables we want to see how do they affect response variable. The problem might be they have different scales (as is the case with bench tonnage vs squat tonnage). So to judge k’s and tau’s we need to normalize those impulse variable. I will try to cover this is another playbook – till then we can use typical workouts as depicted above.
It is important to notice from the above picture that it is the difference between PTE and NTE that matters, not their individual values. So, by looking at the picture above it seems that squat tonnage also contributes to bench 1RM improvements with this athlete. Please not that these are the random data.


Responses