Testing and Training Agility in Sports – Part 2
Previous Part:
Testing and Training Agility in Sports – Part 1
Relationship Between Motor Characteristics and Agility
With a clear understanding of what agility is, i.e. which motor characteristics are necessary for agility to be manifested, it is possible to proceed with examination of motor characteristics that can potentially be trained in order to improve agility. In almost every scientific research in which author tried to assess the relationship between agility and different motor characteristics, as well as the impact of training on both of them, assessment tests in which time was measured were used for agility, with one or more changes of motion direction. Based on already mentioned arguments, it is evident that these tests were not assessing agility, but change of direction speed (CDS). Considering that fact, the validity of these researches is reduced, and the applicability to agility that occurs in real, sports situations on the field becomes questionable.
Most coaches believe that different motor characteristics represent the “foundation” of agility, i.e. the change of direction speed, and therefore its improvement by training has positive effect on the change of direction speed improvement. Rooney (2005) highlights the following motor characteristics as the basis of agility:
- Relative strength (as compared to the athlete’s body mass)
- Linear speed
- Motor coordination (timing)
- Balance (stability)
- Motor programs (technique)
The purpose of this section of thesis is to present the results of the studies regarding the relations between motor characteristics and the change of direction speed, as well as to determine whether the aforementioned Rooney’s and other coaches’ standpoint could be scientifically justified.
Relationship Between Linear Speed and Change of Direction Speed
The question which arises is whether the fastest sprinters are also the most agile athletes. Is the linear speed training, used by sprinters, effective when it comes to improvement of the change of direction speed? One of methods for exploring interrelation between linear speed and change of motion direction speed is to determine the coefficient of correlation between those two capabilities. There are numerous studies which point out specificity of linear speed and change of direction speed (Draper, Lancaster, 1985; Draper, Pyke, 1988; Mayhew, Piper, Schwegler, Ball, 1989). It can be argued that the low correlation in these researches is the result of different total covered distance in tests of linear speed and change of direction speed. However, studies in which the same running distances were used in tests, also reported on specificity of linear speed and change of direction speed (Buttifant, Graham, Cross, 1999; Young, Hawken, McDonald, 1996; Young, McDowell, Scarlett, 2001).
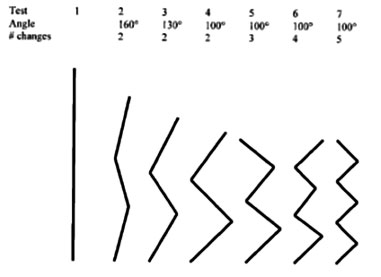
Perhaps an even more important question is whether the linear speed training has transfer on improvement of change of direction speed. Young, McDowell, Scarlett (2001) tried to answer this question. Young et al. (2001) conducted research in order to determine the transfer of linear speed (sprint) training to performance of tasks which demand change of motion direction, as well as the transfer of change of direction speed training to linear speed. Thirty-six men were tested using seven tests; the first one was the test of linear speed on 30m, and the rest were the tests of change of direction speed with 2-5 changes of motion direction with different angles (Picture 3).

Picture 3. Graphic of seven tests with total lenght of 30m. Taken from Young, McDowell, Scarlett (2001), page 316.
Legend: Angles – change of motion direction angles; #changes – number of motion direction changes.
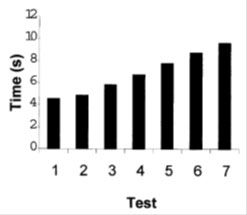
Results of this initial testing (pre-training) are presented on Picture 4. Progressive increase of test results supports the fact that systematica increase of change of direction angle, as well as the number of direction changes increases the task complexity. The longer duration is likely a result of the necessary application of greater lateral forces and more accelerations and decelerations.

Picture 4. Mean of test results in initial measuring (pre-training). Taken from Young, McDowell, Scarlett (2001), page 318.
Legend: Time (s) – Time in seconds; Test – Test by serial number.
After the initial testing the subjects were divided into three groups: (1) sprint group, (2) agility group, and (3) control group. Subjects trained twice a week during six weeks, using 20-40m sprints (sprint group) or 20-40m sprints with change of motion direction (3-5 changes under the 100 degrees angle – like in tests 5-7) (agility group). Linear speed trainings and trainings of change of directions speed were designed to be equivalent in total covered distance, total training volume and strain intensity. The training overview is shown on Table 1.

Table 1. Training program overview, for the sprint and the agility group. Taken from Young, McDowell, Scarlett (2001), page 317. * Applies to agility group only
After six weeks training process, subjects were re-tested. The control group had no significant improvement at any test. The sprint group had a significant improvement only in tests 1 and 2. Agility group had significant improvement in test 2-7 (change of direction speed tests), but not the test 1 (linear speed test). Generally, the sprint group showed greatest improvement in linear sprint, but improvements decreased in tests 2-7, as the change of motion direction task was becoming more complex. The reverse trend is visible with the agility group; improvements were greatest in those tests that were similar to training (5-7), and it decreased as the tasks became less complex (Picture 5).


Responses