
Speed in Modern Professional Football: Scientific Foundations, Applied Biomechanics and Training Methodology

1. Introduction: The Coaching Problem Behind Speed Training
One common risk in football speed training is that it becomes too linear compared with the actual demands of the game. Coaches drill straight-line sprints, time them with cones, and assume the work transfers. In reality, football speed is expressed through acceleration, curvilinear sprinting, braking, change of direction, repeated sprint actions, perception, and tactical context — rarely through a clean 30-metre straight sprint with no opponent, no ball, and no decision to make.
This gap between how speed is trained and how speed is actually expressed in a match is the starting point for this article. Elite football has undergone a radical transformation in its physical demands over the past decade. Load analysis using GPS (EPTS) systems and optical tracking technologies document sustained increases in total distance covered at high intensity, the number of high-magnitude accelerations and decelerations, and distance covered at speeds exceeding 25 km/h (Barnes et al., 2014; Bush et al., 2015).
In football, the relevant speed is not peak laboratory speed: it is the speed expressed at the precise moment the match demands it. Speed in real competition is situational, multidirectional, reactive, and conditioned by accumulated fatigue. Training only the straight-line component while ignoring the rest is one of the most persistent and costly errors in football physical preparation.
1.1 Sprint statistics in professional male football
| Position | Sprints/match | Sprint Dist. (m) | Max. Speed (km/h) | Predominant profile |
|---|---|---|---|---|
| Goalkeeper | 2–8 | 20–60 | 21–24 | COD + reactive starts |
| Central Defender | 10–20 | 80–150 | 27–29 | Long recovery + reactive sprint |
| Full Back | 20–40 | 180–320 | 29–33 | Wide sprint + COD + RST |
| Central Midfielder | 15–30 | 120–220 | 27–30 | Multidirectional acceleration |
| Winger / Wide Mid | 25–50 | 250–400 | 30–35 | Long sprint + off-the-ball run |
| Centre Forward | 15–30 | 120–250 | 28–32 | Stand-start + curvilinear profile |
2. Physiological and Neuromuscular Foundations of Sprint
Running speed is ultimately the result of the neuromuscular system’s capacity to apply force against the ground within extremely short time windows.
2.1 Ground Reaction Force (GRF): the master variable
GRF is the force the ground exerts on the foot in response to the force the foot applies against it. Its three components directly determine the player’s locomotor capacities:
- Vertical GRF: linked to muscle-tendon stiffness, reactivity, and jumping.
- Antero-posterior GRF: the critical component for acceleration. The direction of force application — not just its magnitude — determines sprint efficiency (Morin et al., 2011).
- Medio-lateral GRF: central in COD and curvilinear sprint.
In a football sprint, ground contact time ranges between 80 and 120 ms. Elite sprinters apply more force in less time — not more contact time.
2.2 Rate of Force Development (RFD) and F-v profile
RFD is more relevant than maximal isometric strength for predicting acceleration performance when ground contact times are below 150 ms (Aagaard et al., 2002). The Morin-Samozino force-velocity profile (2016) identifies whether a performance deficit is due to low force (force-deficit) or low velocity (velocity-deficit), allowing the most appropriate method to be prescribed for each athlete.
2.3 Central nervous system and speed
Type IIx fibre recruitment, intermuscular synchronisation, and reflex inhibition of braking are neural variables that condition speed (Ross et al., 2001). The CNS needs freshness to produce speed: complete recovery between repetitions, low volume, maximal intensity.
| System | Duration | Substrate | Football relevance |
|---|---|---|---|
| Anaerobic Alactic Power | 0–6 s | ATP-PC | Acceleration, starts |
| Anaerobic Alactic Capacity | 6–18 s | ATP-PC + glycolysis | Long sprint, transition |
| Anaerobic Lactic Power | 18–36 s | Anaerobic glycolysis | Sustained pressing |
| Anaerobic Lactic Capacity | 36–42 s | Glycolysis + lactate | Extreme situations |
3. Biomechanics of Sprint in Football
3.1 Phases of the sprint
Acceleration (0–20 m) — the most relevant phase in football
- Strong trunk lean, short and frequent steps
- High horizontal force production, high Ratio of Force (RF)
- High demand on hip extensors: glutes and hamstrings
Maximum velocity (>40 m)
- Spring-mass model: contact time 80–100 ms
- Vertical GRF dominates. Ankle-foot SSC: 50–60% of propulsion
- Upright posture, raised knee, elbow at 90°
3.2 Curvilinear sprint: the most underrepresented content
Caldbeck et al. (2020) established that approximately 85% of sprints in competition follow a curved trajectory. This implies radically different biomechanical demands from linear sprinting:
- The outside leg applies greater GRF and acts as the main propulsive lever
- Systematic biomechanical asymmetry between both limbs
- Achievable speed is reduced by 8–15% relative to linear sprint
Methodological implication: training only linear sprint represents partial transfer to real football. Curvilinear sprint should be trained systematically throughout the season in both directions.
| Variable | Linear Sprint | Curvilinear Sprint | COD (>60°) |
|---|---|---|---|
| Dominant GRF | Antero-posterior | Med-lateral + AP | Med-lateral (braking) |
| Contact time | 80–120 ms | 100–140 ms | 140–200 ms |
| Bilateral symmetry | High | Low | Very low |
| Eccentric demand | Low-Moderate | Moderate | Very high |
| Injury risk | Low | Moderate | High |
4. Acceleration: A Decisive Quality in Football
The capacity to accelerate from a static position or low velocity is among the most determining physical qualities in competitive performance (Faude et al., 2012). Its frequency of occurrence in goal-scoring situations, duels, and defensive recovery makes it a priority focus of speed training.
4.1 Limiting factors
- Absolute horizontal force production (linked to relative maximal strength and RFD)
- Ratio of Force (RF): direction of application relative to displacement
- Body projection angle (trunk lean)
- Reaction time and stimulus processing speed
| Objective | Start type | Distance | Reps | Sets | Session Vol. | Rest |
|---|---|---|---|---|---|---|
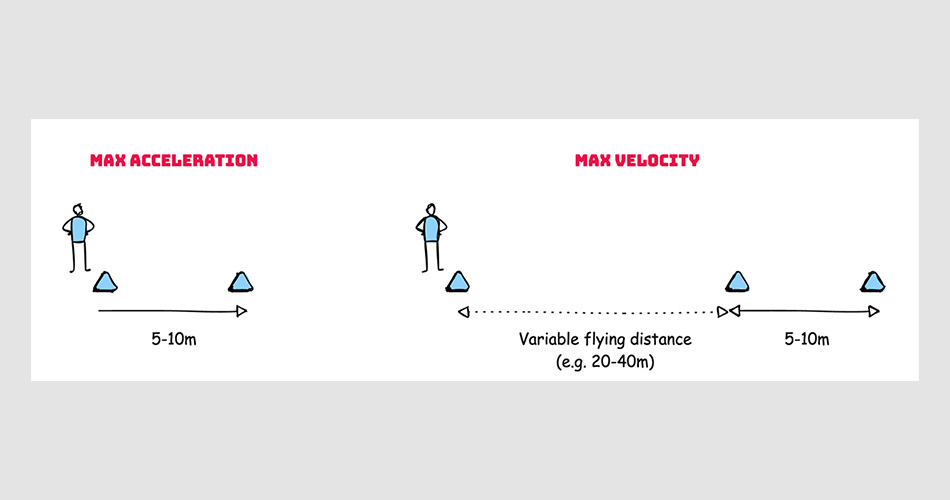
| First steps | Frontal / Lateral / Back | 5 m | 3–5 | 2–3 | 60–100 m | 30–45 s |
| Initial accel. | Seated / Prone / Kneeling | 10 m | 3–4 | 2–3 | 80–120 m | 45–60 s |
| Mid accel. | Visual / auditory cue | 15 m | 3–4 | 2–3 | 100–160 m | 60–90 s |
| Full accel. | Standing frontal | 20 m | 2–4 | 2–3 | 120–200 m | 90–120 s |
When to prioritise this table:
- Pre-season weeks 1–4, and as a year-round technical foundation for every player
- Players returning from injury, before progressing to maximal velocity work
- Any week where match congestion limits total sprint volume — acceleration work is lower-cost and high-transfer
5. Maximum Velocity: The Performance Ceiling
Exposure to speeds >90–95% of individual Vmax is the minimum effective stimulus threshold for neuromuscular adaptations. Mendiguchia et al. (2020) demonstrated that lack of exposure to real Vmax is an independent risk factor for hamstring strain.
Vmax exposure and injury prevention — the link is direct, not incidental: The same Mendiguchia et al. (2020) data showing Vmax exposure as a performance variable also shows it functioning as a protective mechanism. Under-dosing maximal speed does not just limit performance — it may increase hamstring injury risk by reducing regular exposure to high-speed sprinting. Coaches who avoid Vmax work entirely out of caution may sometimes increase, rather than reduce, the risk they are trying to avoid.
You do not necessarily need to sprint at Vmax every week — but with sufficient frequency that the body is prepared when the match demands it.
| Format | Free Zone | Max Zone | Reps | Sets | Rep Rest | Set Rest | Session Vol. |
|---|---|---|---|---|---|---|---|
| Basic | 15 m | 20 m | 3–4 | 1–2 | 3 min | 5 min | 60–100 m |
| Standard | 20 m | 25 m | 3–4 | 1–2 | 3–4 min | 5–6 min | 80–120 m |
| Advanced | 25 m | 30 m | 2–3 | 1–2 | 4 min | 6 min | 90–130 m |
When to prioritise this table: In most standard microcycles, once the player has an established acceleration and technical base — planned regularly, not treated as a rare add-on. MD-4, when neuromuscular freshness allows true maximal output (avoid on short turnaround weeks). Returning players: reintroduce progressively, but do not skip entirely — the injury-prevention argument above applies most to this group.
6. Curvilinear Sprint: Specific Training
Despite representing 85% of match sprints, curvilinear sprint is the most absent content in the training programmes of most clubs.
6.1 Biomechanical foundations
- Medial body lean toward the centre of the arc
- Outside leg: greater GRF, greater demand on glute and external adductor
- Inside leg: trajectory guidance, greater demand on adductor and abductor
- Chronic asymmetry: possible risk factor for hamstring and adductor injury (Judson et al., 2021)
| Variant | Arc Radius | Distance | Reps (per side) | Sets | Rest | Session Vol. |
|---|---|---|---|---|---|---|
| Light curves | Wide (>20 m) | 20–30 m | 2–3 | 2–3 | Full | 80–120 m |
| Medium curves | Medium (10–20 m) | 20–30 m | 2–3 | 2–3 | Full | 80–120 m |
| 1/4 circular + linear | Variable | 20–40 m total | 2–3 | 2–3 | Full | 100–150 m |
| 1/2 circular + linear | Variable | 30–50 m total | 2–3 | 2 | Full | 100–140 m |
| Full circular | 15–25 m | Perimeter | 2 | 2 | Full | 80–120 m |
When to prioritise this table:
- Year-round, from mid pre-season onward — this is not a late-block specialty, it is core content
- Wingers and full backs especially: their positional profile involves the highest curvilinear demand
- Always train both directions equally to manage the systematic bilateral asymmetry described above
7. Change of Direction (COD) and Deceleration
CODs generate braking forces of up to 3–5 times body weight, with maximal eccentric demand on quadriceps, hamstrings, and adductors. The conceptual difference between COD (closed skill) and agility (open skill, with decision-making) has direct methodological implications.








Responses