Monitoring System in Excel
Most practitioners are collecting and analysing GPS training load data every day. In this video I will walk through the monitoring system I have developed during my experience as sports scientist and strength and conditioning coach.
Different companies provide different metrics but the ones that are mostly analysed are kinematic metrics (i.e. total distance, high speed distance and accelerations). In addition to those metrics, I am an advocate of the analysis of metabolic power in order to analyse the high intensity actions which cannot be detected by kinematic metrics (you can find other posts on Complementary Training related to Metabolic Power).
Regardless of the metrics a practitioner decides to analyse, I found that the main obstacle I had to overcome was providing a simple yet effective feedback to the coaching staff regarding a session or a micro cycle. At the end of the day, coaches only want an answer to a very simple question: “How hard did we work today/this week?”.
For this reason, I found the concept of multi mechanical model very useful and, following the work of Tom Allen and Jack Sharkey, I created one session score for volume and one for intensity. Both scores go from 1 to 10, with 10 matching game demands.
The metrics I used in order to calculate the two scores are showed in the following table.

In the monitoring system that I developed, individual values of a single session are divided by the game individual average in order to have a percentage relative to the game (only games that have been played 90 or more minutes are taken into consideration). Hence, every session is compared to the average game demands of each individual player.
Here is a practical example for a particular session

In this instance, the Volume score for Jon will be:

The same applies to the intensity metrics:

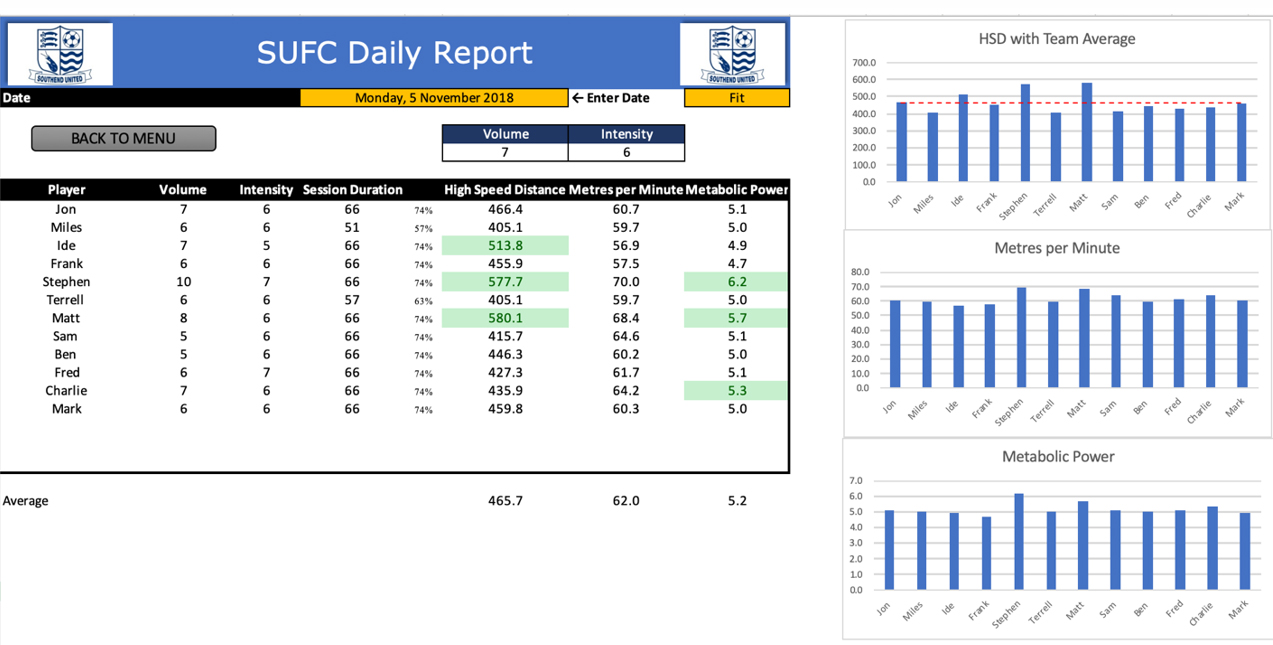
Those scores appear in the daily report that will be the feedback given to the coach where the average of the individual scores will give him two overall scores of volume and intensity for the session.

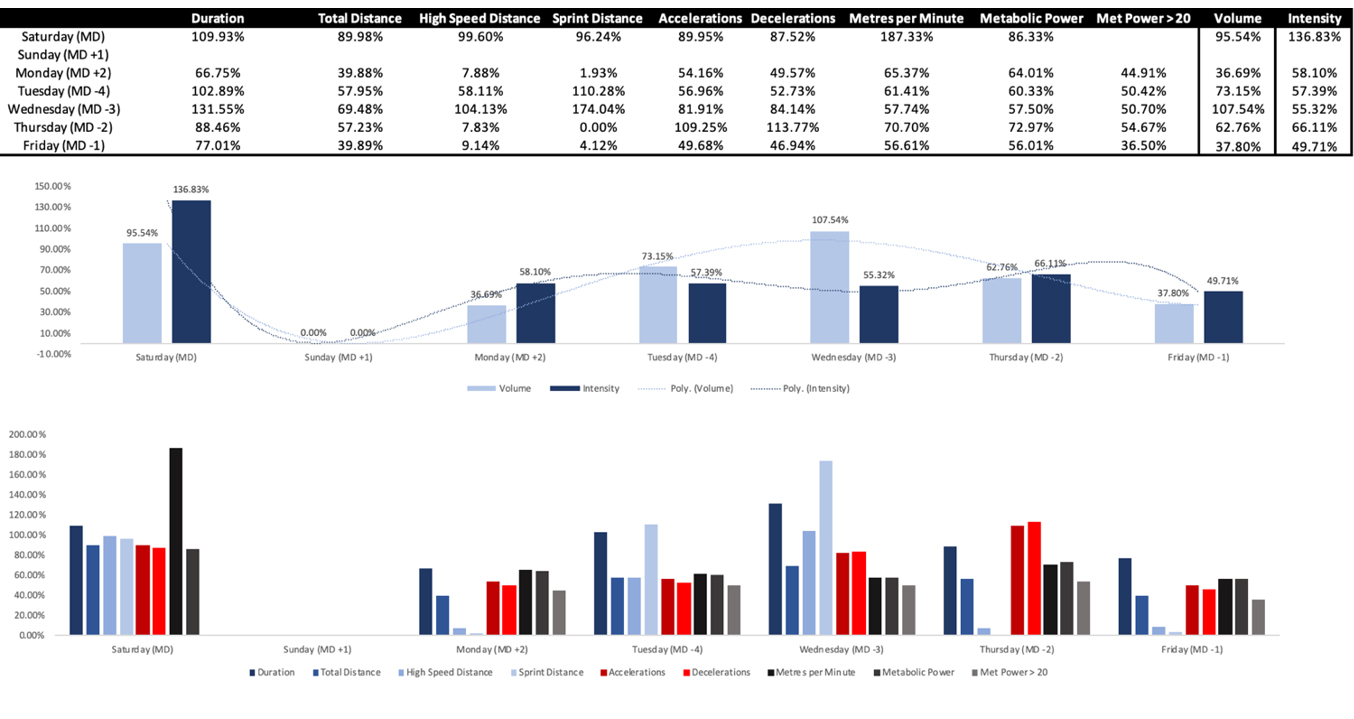
Single sessions can then be contextualised within the weekly microcycle.

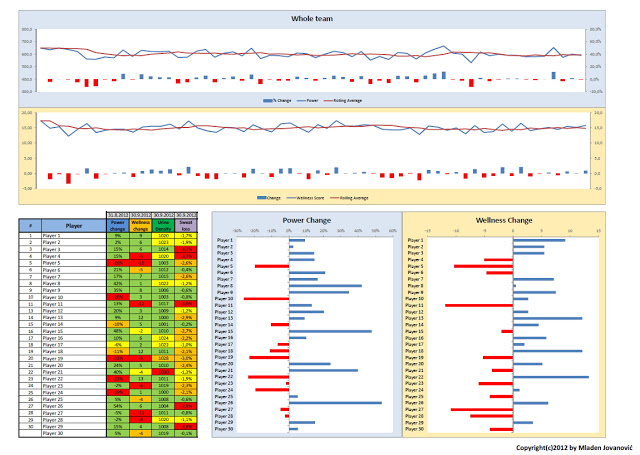
This is only one section of the monitoring system, other areas include exponentially weighted training stress balance calculations, week to week workload changes and longitudinal reports.
I would like to thank again Mladen for the opportunity to post on this blog and I hope you’ll find the content of the video interesting.
If you have any question you can find me on twitter or you can send me an email.


Responses