HRV4Training Pro
HRV4Training Pro is the ultimate platform for individuals and teams that want to learn more about how their body is responding to different stressors associated to training and / or lifestyle.
HRV4Training Pro is compatible with client apps on both iPhone and Android and requires a HRV4Training account as well as a subscription that can be purchased from the web platform.
HRV4Training Pro is a responsive web platform, meaning that it looks good and scales well on all resolutions, including smaller phones. This way you can use it on the move too.
Main Features
In this section, we look in more details at most features and functionalities available in HRV4Training Pro:
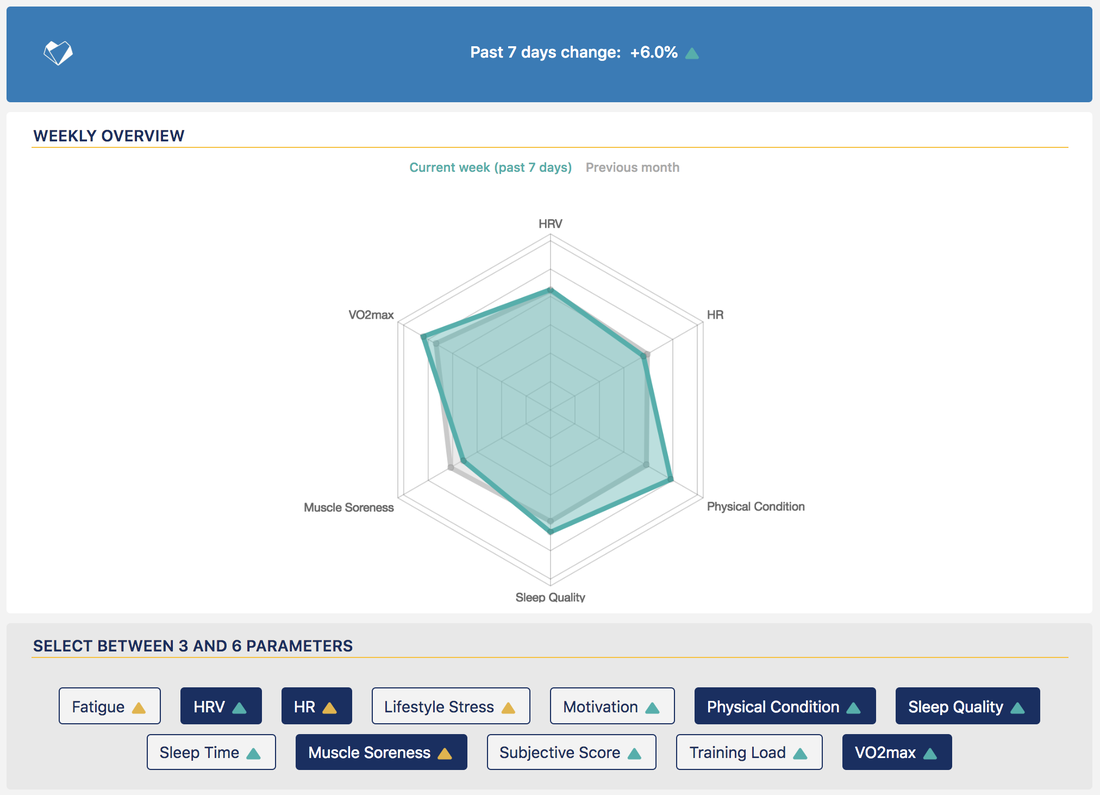
- Dashboard: overview of daily HRV, subjective score, combination of HRV and subjective score (daily advice), and recent trend combining between 3 and 6 parameters of your choice. This view aims at providing a quick overview of how you are doing, for parameters relevant to you, and relatively to your previous few weeks, so that you can easily track progress.
- Overview: HRV4Training Pro features an overview that aims at easing interpretation of HRV data for your own analysis as well as your team data. The view shows desirable range (normal values), HRV baseline and optionally lets you highlight each recording with your tags, as well as training load.
- Calendar: the calendar, as the name says, is a calendar view of your historical data, so that you can easily browse through your data. You can change the shape and color of each individual day based on parameters you log, so that you can quickly explore and make sense of the data.
- Insights:
- Resting physiology: this view provides more insights on the big picture. Looking at baseline changes on multiple parameters relevant to your physical condition (e.g. HRV, HRV, coefficient of variation), the web app can automatically determine if a recent HR or HRV trend is changing in a trivial way, or if the change is something to take more seriously, based on historical data. Based on a combination of physiological parameters and training load, the app will also estimate your current condition, if you are for example adapting well to a specific training block, or having issues and risking to accumulate fatigue or to go into overtraining.
- Training load analysis: pick the metric most representative of your training (e.g. RPE, TSS, Relative Effort, training distance, etc.) and analyze fitness & fatigue, determined as chronic and acute training loads, as well as readiness to perform and injury risk.
- Training intensity analysis: This analysis allows you to get an overview of how hard your are training. You can pick a parameter on which to base your analysis (e.g. heart rate, power or RPE), and two thresholds, one for low intensity work and one for high intensity work.
- Explore Correlations: mainly for exploratory analysis inside the app. Look at what factors are related to physiological changes, and try to make adjustments accordingly.
- Lactate threshold estimation: for runners using the Strava or TrainingPeaks integration and training with a HR monitor, HRV4Training can estimate lactate threshold, and provide advice on pacing strategies for racing and workouts.
- Half and full marathon time estimation: for runners using the Strava or TrainingPeaks integration and training with a HR monitor.
- VO2max estimation: for runners and cyclists using the Strava or TrainingPeaks integration and training with a HR monitor (and power meter).
- Functional Threshold Power (FTP) estimation: for cyclists using the Strava or TrainingPeaks integration and training with a HR monitor and power meter.
- Aerobic Endurance analysis: Aerobic endurance (or aerobic efficiency) relates to your ability to sustain a given workload. To determine your aerobic endurance we compute the relation between output (pace or power) and input (heart rate).
- Weekly and Montlhy workout summaries: pick the metric most representative of your athlete’s trainings (e.g. RPE, TSS, Suffer Score, training distance) and analyze training load breakdowns by week and month to keep better track of overall progress.
Team
HRV4Training Pro provides all functionalities above, plus a few extra, for coaches that wish to use the platform with their athletes, as well as teams. In particular, you will be able to:
- Receive and synch your athletes’ data right after they’ve taken the morning HRV measurement, from iPhone and Android clients., so that you can analyze their data remotely.
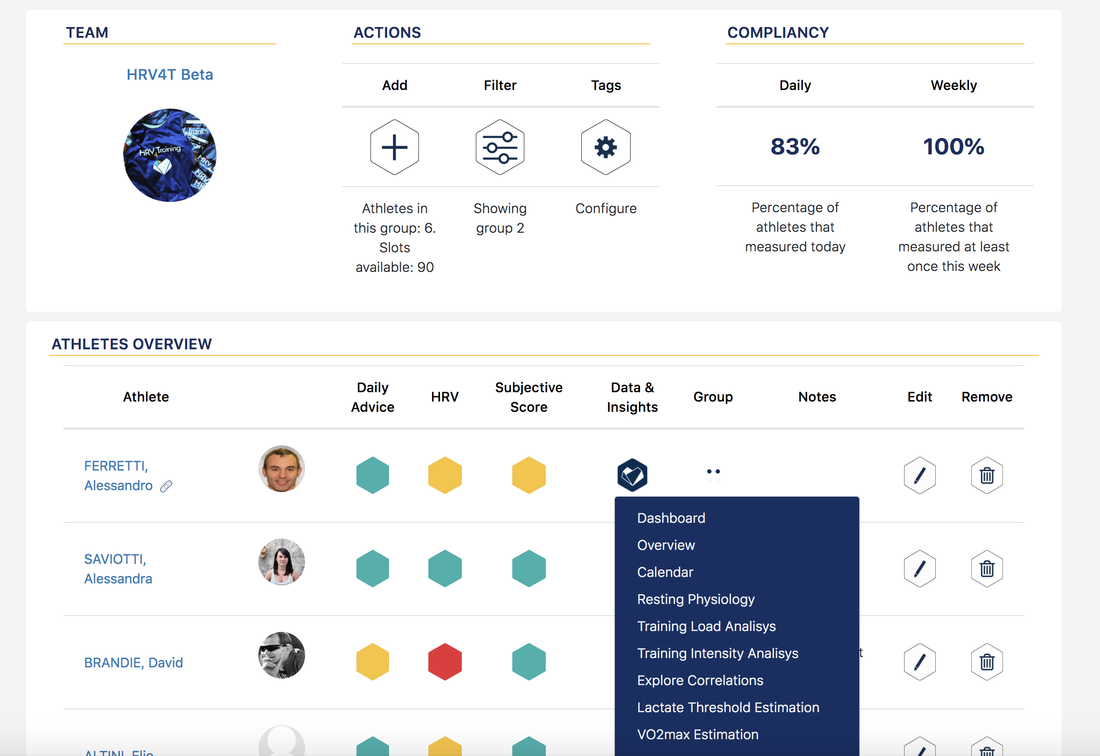
- Monitor daily values and deviations from your athlete’s baseline and receive daily advice to make meaningful adjustments to training programs. The athletes list provides an overview of the daily advice, daily HRV and subjective score, so that you can get an overview of your entire team and take action without having to go through all the data for each individual athlete. Additionally, you will also be able to see at a glance daily annotations from your athletes.
- Group and filter athletes.
- Remotely configure all tags your athletes should be using, optionally hiding the daily advice.
- Monitor your athlete’s compliance
- Export all data as csv files
- Customer support
Our Approach
HRV4Training Pro was built on the experience gathered in the past 10 years while developing HRV4Training and supporting our community of recreational and professional athletes. Thanks to the many interactions with users and teams, we fine tuned this platform to highlight what we believe is the most effective way to analyze physiological data. In particular, we strongly relied on the following principles:
- everything is relative
- going beyond day to day variability
- multiparameter is key
Let’s look at them a little more in detail before we move on to the user guide.
Everything is Relative
Physiology needs to be always analyzed with respect to an individual’s historical data or normal values. In HRV4Training Pro we take this approach to the next level, allowing users and teams to build their own set of metrics and track progress over time, for example with the new dashboard in which you can pick up to 6 parameters and see how they have been evolving this week, with respect to the previous month. We don’t stop at the past week and month, but interpret changes with respect to your past few months of data, so that relative changes this week can be put into perspective, based on what are normal changes for you.
Going beyond day to day variability
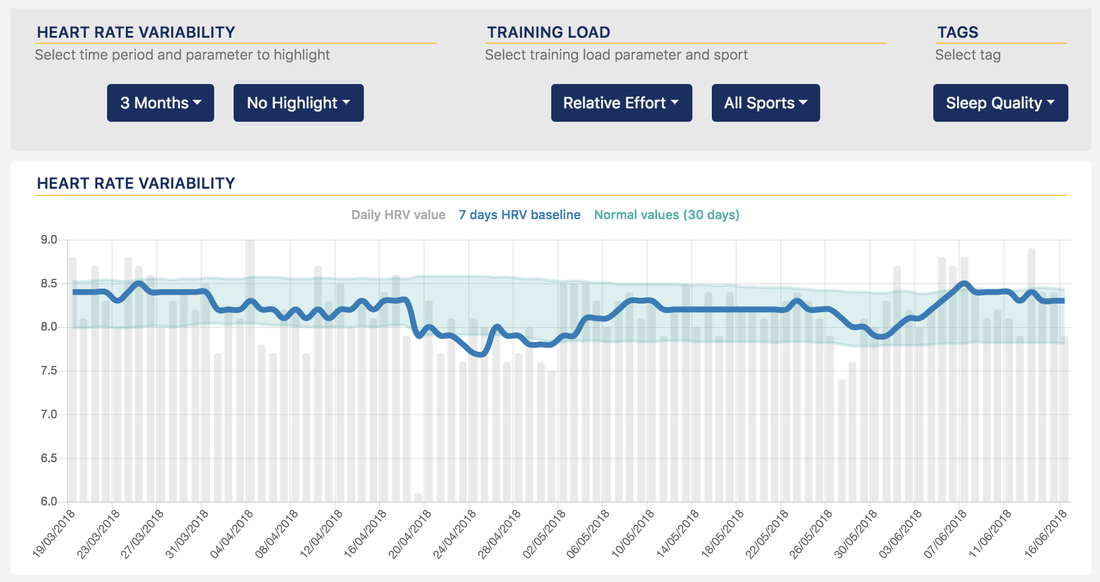
The second most important point is the ability to abstract and go beyond day to day variability and acute changes, so that we can focus on baseline changes and the big picture. This is true not only for physiological measurements, but also other modeling techniques used for example to estimate freshness or injury risk. For example, HRV4Training Pro builds on our previous work on physiological trends to easily highlight how your baseline is changing with respect to your historical data and allow you to understand if variations are just normal or are consistently outside of your normal ranges:
Similarly, you can see below how acute and chronic load as well as freshness and injury risk can be abstracted at the week level and in relative terms, to provide more meaningfull feedback.
HRV4Training Pro features an overview that aims at easing interpretation of HRV data for your own analysis as well as your team data. The view shows desirable range, HRV baseline and optionally lets you highlight each recording with your tags, as well as training load.
The first step to understand the advanced view is to understand day to day variability and trends. Your baseline is simply a more stable version of your daily score. It shows how your recent data is looking, but it doesn’t say much about what your normal values are, and if your daily score is within your normal values or not. Your baseline could be completely below your normal values on a bad week for example. To solve this problem, we use part of your historical data (60 days) to determine what your normal values are. Your normal values, sometimes called “being within your SWC or smallest worthwhile change”, are typically quite a broad range as HRV data changes quite a bit on a daily basis. We then look at your daily score with respect to your normal values, and not only with respect to your 7 days baseline. This way your normal values are continuously updated and you don’t need to worry about setting a specific time frame.
Multiparameter is key
While heart rate variability is a strong marker of physiological stress and can be extremely valuable per se to track it, it is obvious that the ability to collect and analyze multiple physiological (and not only physiological) parameters is key to aid interpretation and provide additional context around our measurements. HRV4Training Pro makes it very easy to look at the big picture, for example in the dashboard view shown above, or with the resting physiology analysis and correlations analysis.
HRV4Training Pro can analyze multiple parameters collected over longer periods of time (weeks to months) to better understand the big picture and how you are responding to your training program. Analysis of multi-parameter HRV trends is experimental and might change in the future. As of the current version of HRV4Training Pro, the analysis relies on the past 60 days of data to determine what physiological changes are non-trivial, and then combines multiple physiological parameters as well as training load, to determine the most likely physical condition pattern.
Main parameters used:
- Heart rate variability: an increase in HRV is typically associated with coping well with training and improved fitness level. A reduction is not necessarily bad, it could be associated to parasympathetic saturation or tapering.
- Heart rate: in general, an increase in HR is associated with more fatigue, unless it is occurring during tapering. A reduction is most of the times associated with coping well with training and better fitness.
- Coefficient of variation (CV): the CV of your HRV represents how much your values are varying in the past two weeks. A decrease in CV associated with higher HRV and lower HR can be representative of coping well with training, while a decrease associated with lower HRV can show risk of non-functional overreaching. An increase in CV might also reflect some trouble in adapting to a new training block
Coach & Team features
HRV4Training Pro provides all functionalities above, plus a few extra, for coaches that wish to use the platform with their athletes, as well as teams. In particular, you will be able to:
- Receive and synch your athletes’ data right after they’ve taken the morning HRV measurement, from iPhone and Android clients., so that you can analyze their data remotely.
- Monitor daily values and deviations from your athlete’s baseline and receive daily advice to make meaningful adjustments to training programs. The athletes list provides an overview of the daily advice, daily HRV and subjective score, so that you can get an overview of your entire team and take action without having to go through all the data for each individual athlete.
- Group and filter athletes.
- Remotely configure all tags your athletes should be using, optionally hiding the daily advice.
- Monitor your athlete’s compliance
- Export all data as csv files
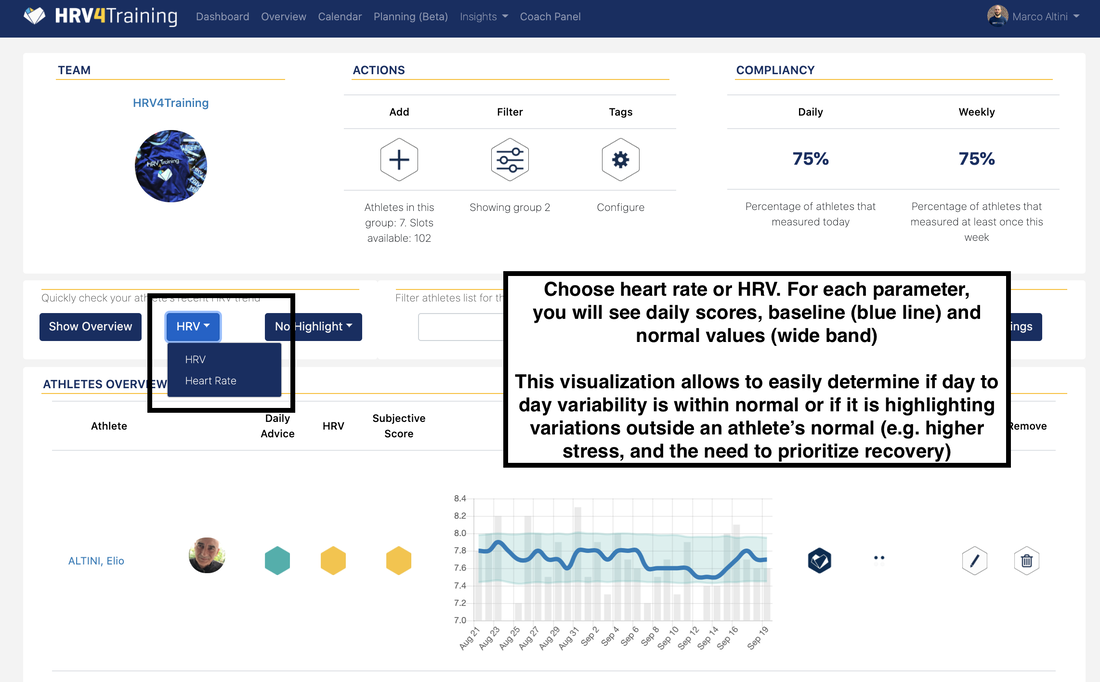
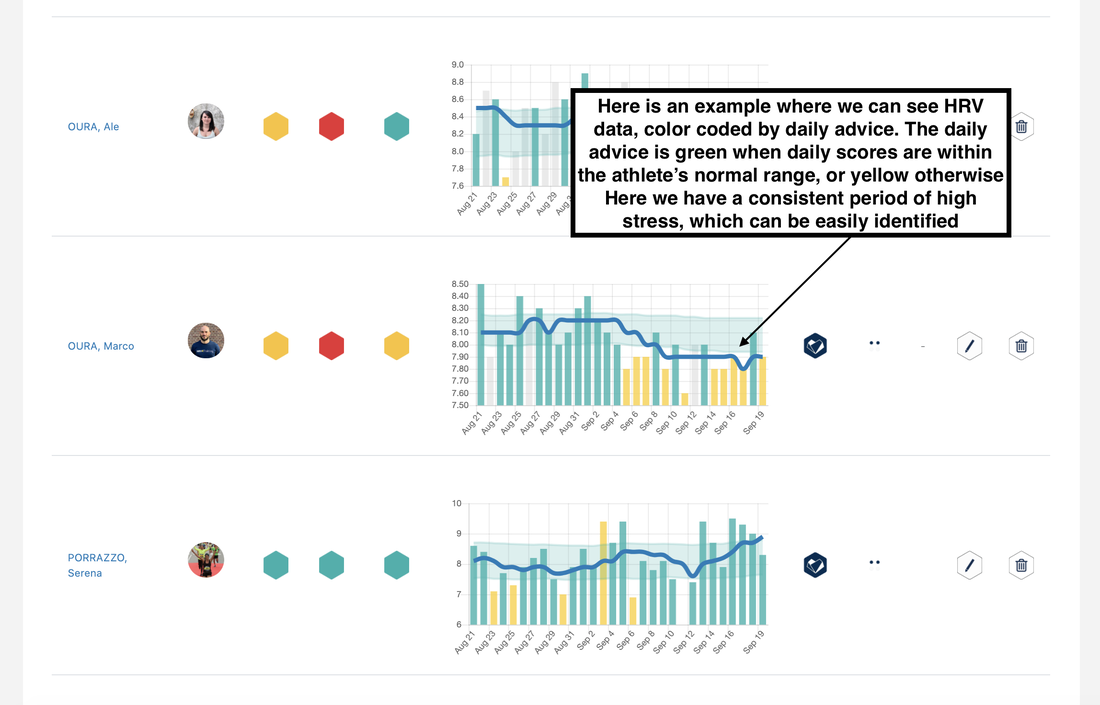
From the Coach Panel you will also be able to see quickly any tags such as injury, menstruation, sickness, travel and manual notes that an athlete might provide for you. You will also be able to jump directy into one of the other views, using the Data & Insights button.




Responses