How to create individualized exercise profile in strength training? Part 2: Load/Velocity Profile
Previous parts:
How to create individualized exercise profile in strength training? Part 1: Testing
I am repeating the data from the previous part before I start with the analysis and visualization.
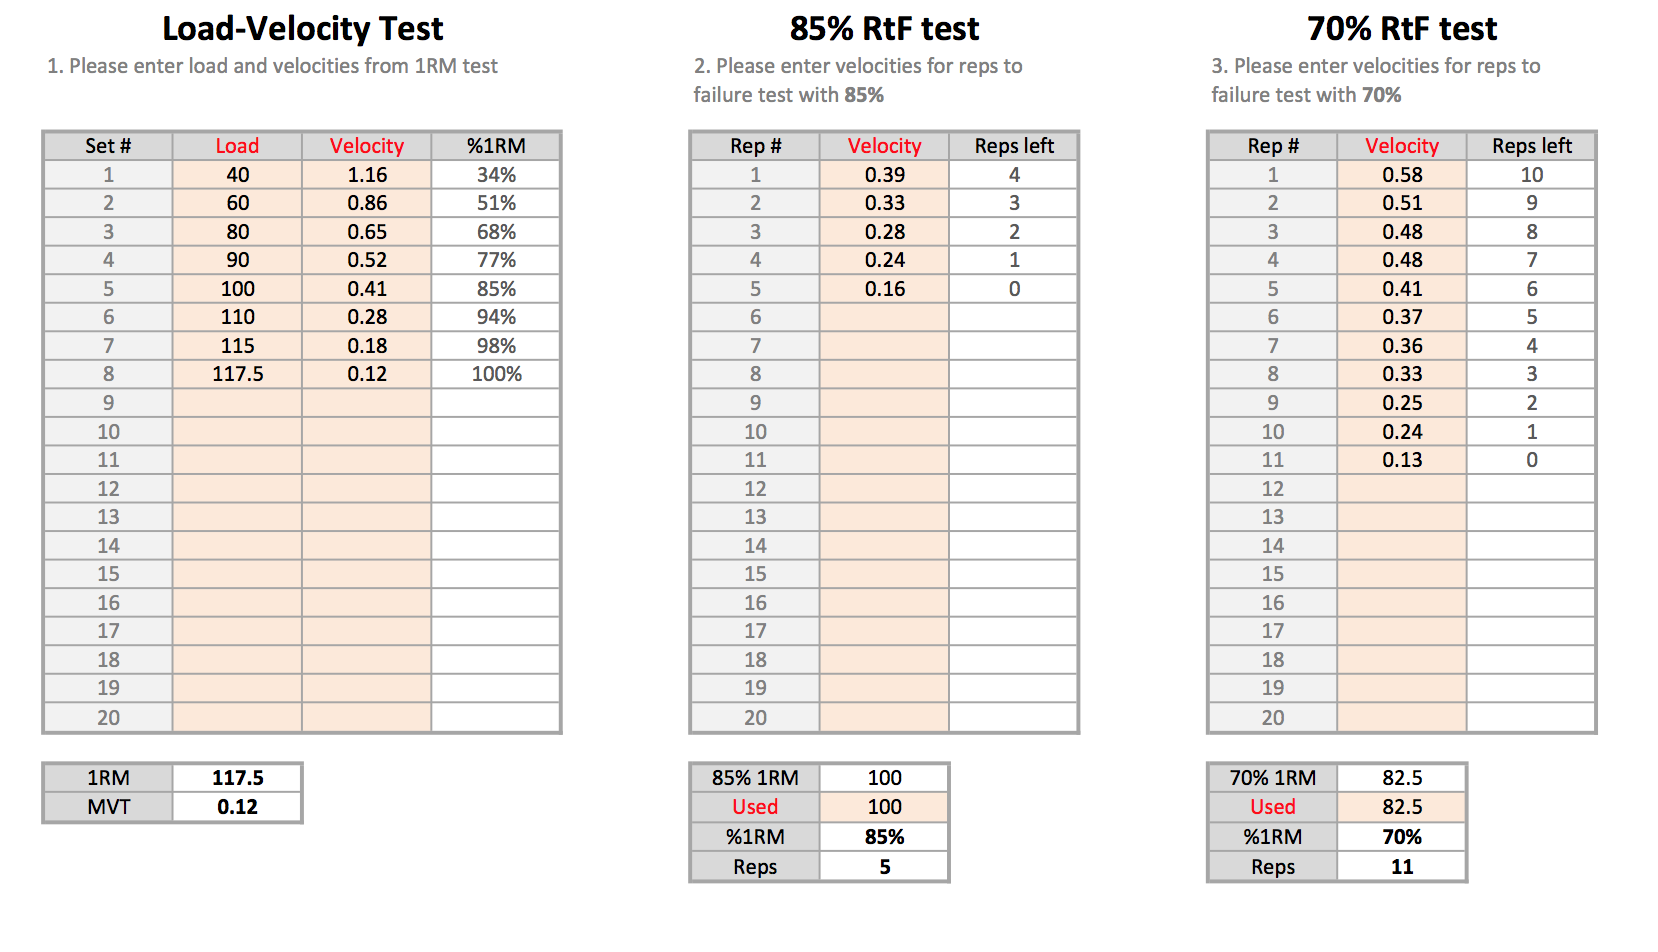
Mladen’s performance
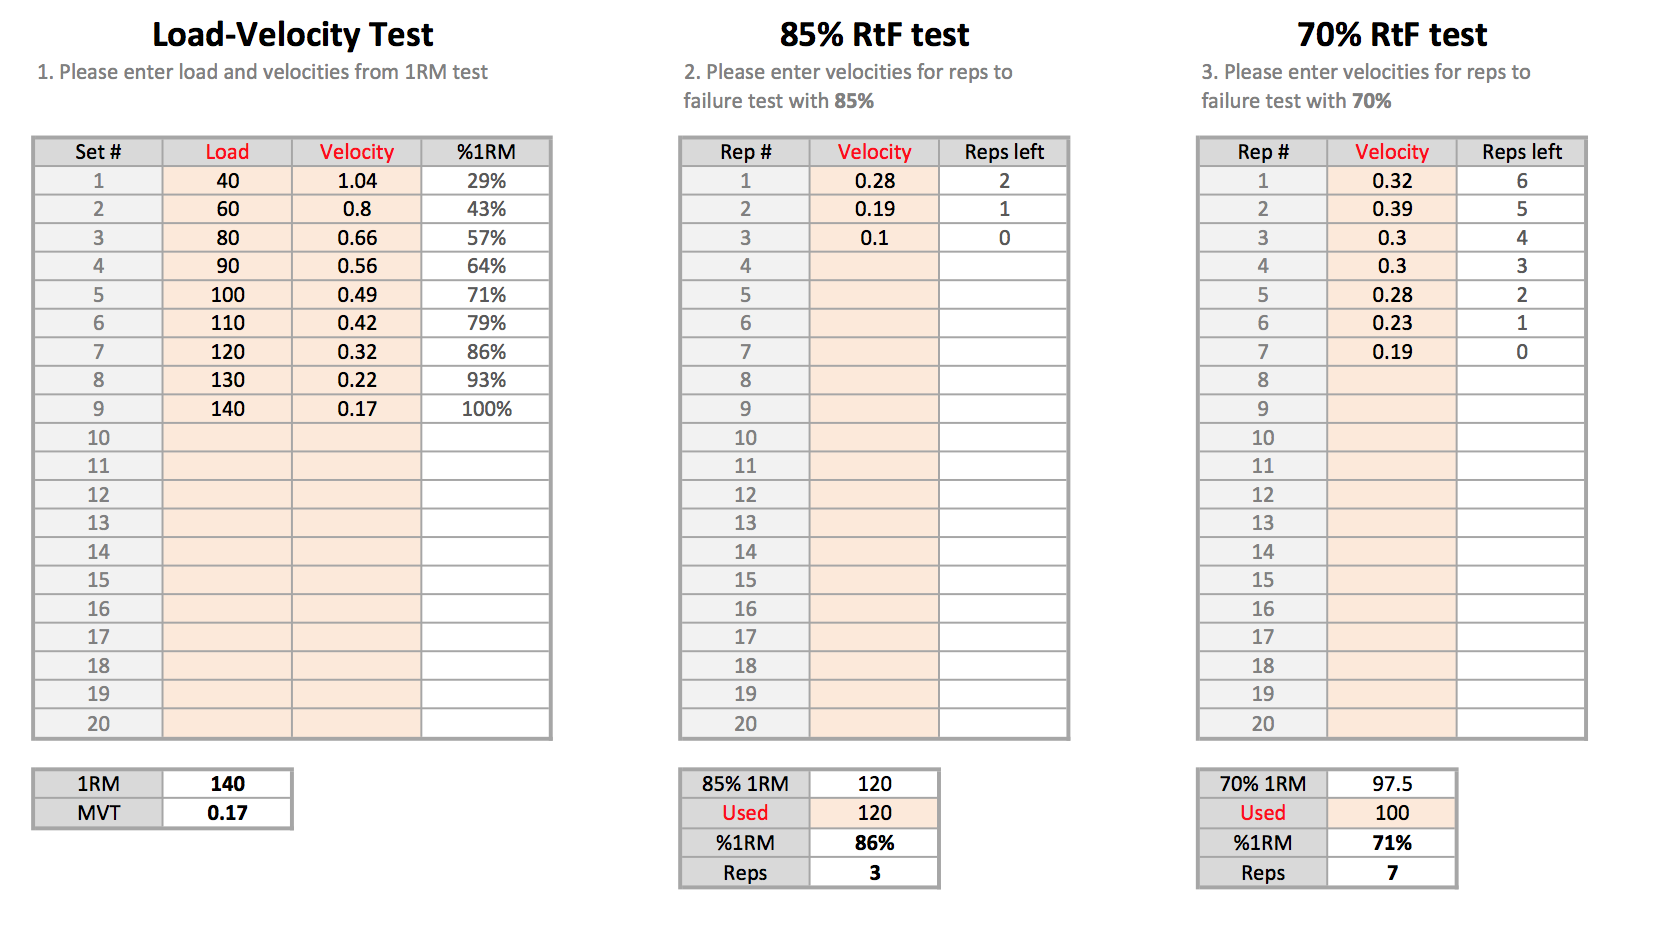
Ivan’s performance
As you can see my 1RM in bench press with ~2-sec pause is 117.5kg and Ivan’s is 140kg.
Load/Velocity Profile
The first step to do is to analyze the 1RM progressive test (first box). The test is basically doing singles as fast as possible at increasing loads, until you can’t lift it. The pause is ~3min between sets (maybe shorter for those <80%).
On the following pictures you can see Load/Velocity profiles and the basic stats which I will cover.
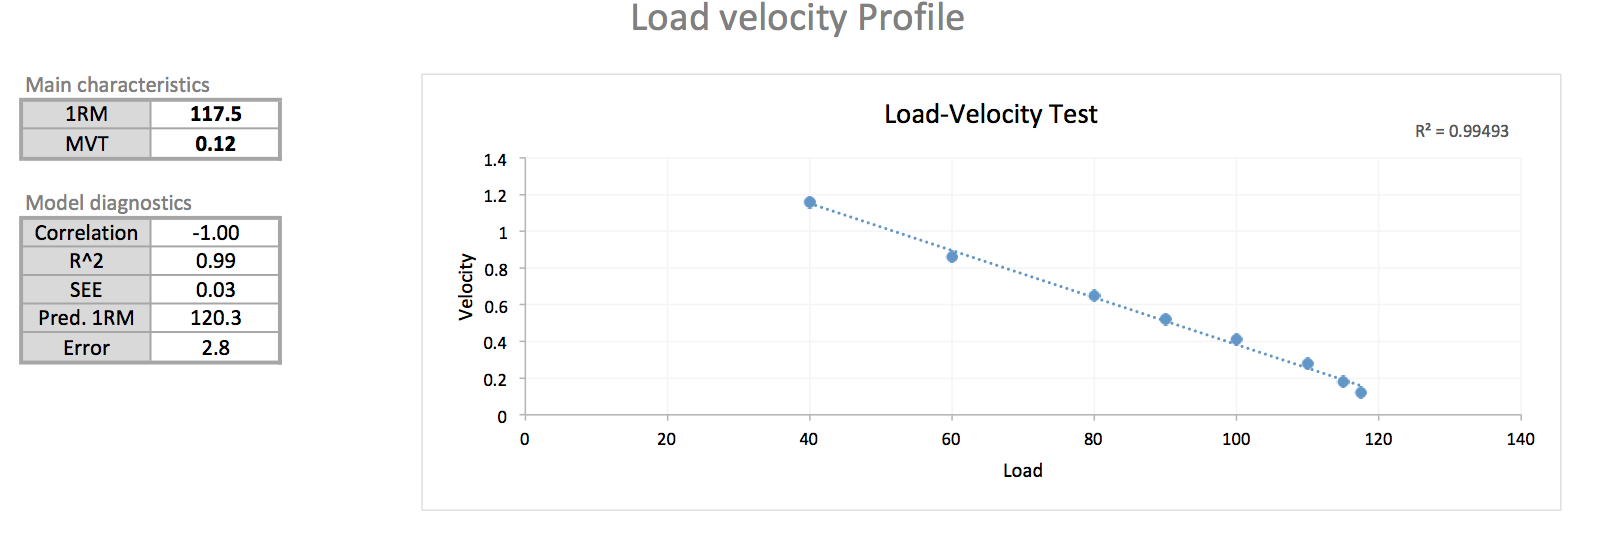
Mladen’s Load/Velocity Profile
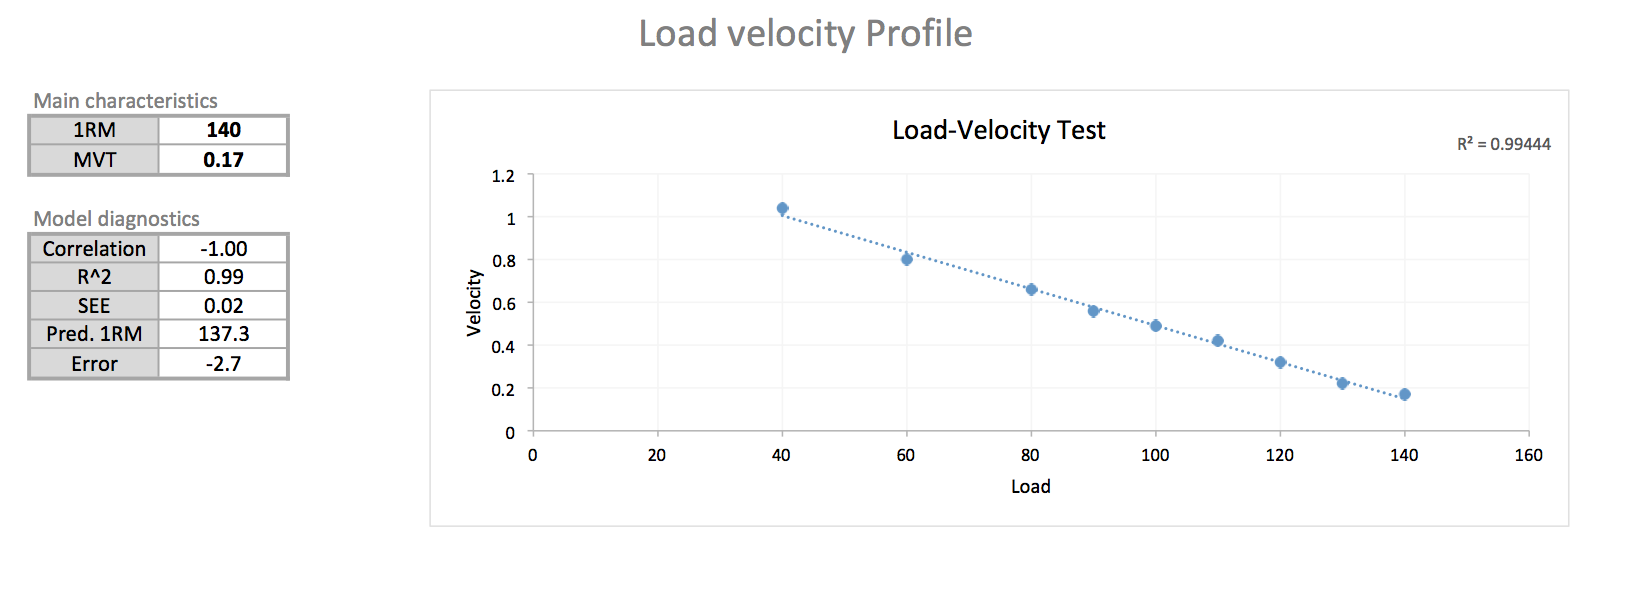
Ivan’s Load/Velocity Profile
What is immediately apparent is the linear relationship between load and mean concentric velocity. Variance explained is nearly perfect for both me and Ivan. Error term is the difference between estimated 1RM from the data (using linear regression) and real 1RM, and as you can see it is around 3kg.
One VERY important thing to pick-up from Load/Velocity relationship is MVT or “minimal velocity threshold”, or in simple English velocity of 1RM attempt. This appears to be pretty ‘stable’ parameter both between athlete and during the period of training. I do need to repeat this test in the near future to see if MVT changes when 1RM changes.
As you can see mine and Ivan’s MVTs are pretty similar even if we have different 1RMs (117.5kg vs 140kg). What this tells us is that it is not the velocity of 1RM that is different, but the force one can achieve at that velocity. Well, duh.
By knowing athletes MVT, one can estimate 1RM from submax (warm-up) sets. This gives us neat way to track daily 1RMs without actually performing 1RM test. This ‘daily 1RM’ could be used together with load being done to model training cycle and individualize training based on the athletes reaction (for more see excellent paper by Clarke and Skiba). One can use this daily 1RM to prescribe working sets, instead of using pre-cycle 1RM or competition 1RMs. This is just one level of implementation of velocity-based exercise prescription.
When it comes to selection of warm-up sets for 1RM estimation, I did optimization in Excel (using Solver add-on) to find which 3 warm-up sets gave me the least error from real 1RM using this data (except sets <85%). I’ve got 1st, 2nd and 3rd set, or 35%, 50%, 68% (error 2.3kg; predicted 1RM 119.8kg: real 117.5kg), and Ivan got 4th, 6th and 7th set or 64%, 79% and 84% (error 0.1kg; predicted 1RM 139,9kg; real 140kg). So, I guess using sets ranging from 40% to 80% might be a good choice with the daily 1RM estimation objective.
Comparing individuals Load/Velocity using relative and absolute approach
One the following picture is mine and Ivan’s velocities based on %1RM and real load [kg].
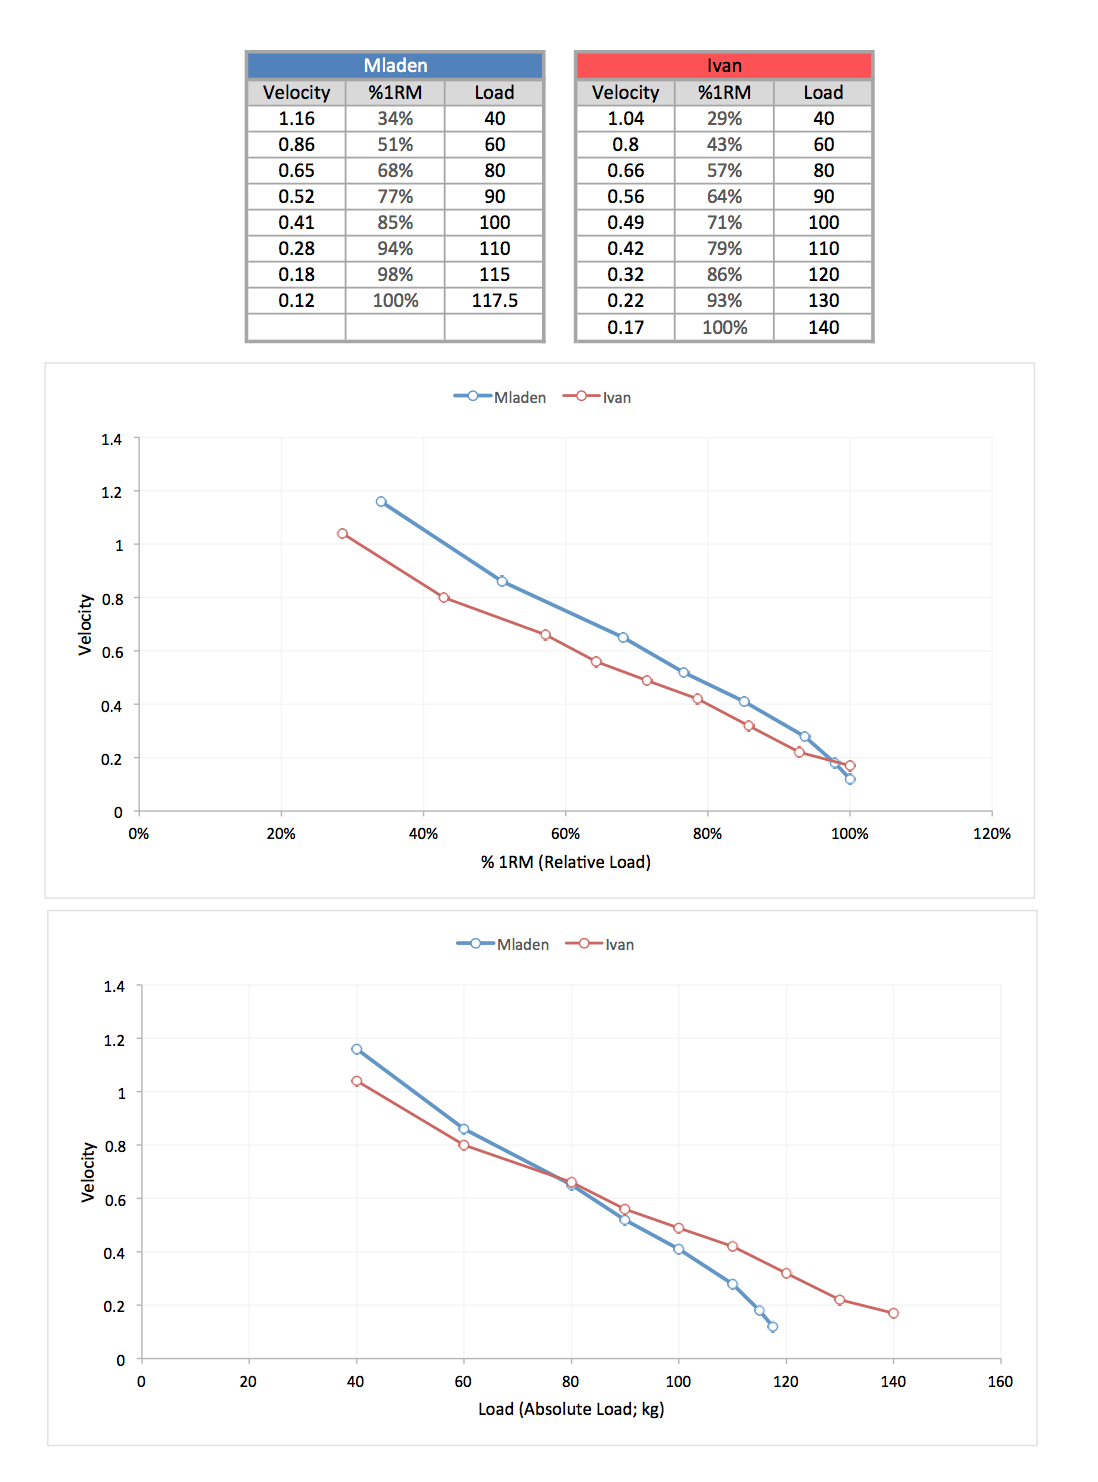
Mladen vs. Ivan in both relative and absolute terms
As can be seen from the pictures, when it comes to relative loads (expressed as %1RM) I am faster than Ivan in all sets except 1RM (which can be an error due weight jumps, etc).
When it comes to absolute loads (in kg), I am again faster until 80kg, then Ivan is killing me, mostly because of his higher 1RM.
What does this mean? To be honest I am not sure. It might mean that there is a difference due the level of the 1RM. It might mean that I am used to performing my sets with CAT (Compensatory Acceleration Training) and Ivan was not. It might mean that I might have more FT fibers. It might mean that I am more powerful. To to be honest, I don’t know what it means beyond what the picture says.
In the next part I will cover Reps-to-Failure Profiles and how to create individualized reps-max table (which is needed for Load/Exertion table)




Responses