From Attenuation to Adaptation: An Exploratory Sandbox for Modeling Training Load Equivalence
Reconciling the Volume‑as‑Distance Inconsistency through Exponential Decay
A Note on the Exploratory Nature of This Work
This paper is presented as a conceptual sandbox – an open, iterative exploration rather than a definitive statement. The model described below emerged from a deliberately messy process: the initial analogy between sound attenuation and training load shifted mid‑development from “the organism’s current state as the attenuating medium” to “work volume as the distance variable.” This shift created inconsistencies and a critical logical flaw. Rather than hiding this evolution, we embrace it. By exposing the tension explicitly, we arrive at a more robust exponential formulation.
The reader is invited to treat this document as a working prototype – a tool to be tested, criticised, and refined.
The final exponential model (E=I×e−V/k) is proposed not as a settled law but as a promising hypothesis that regulates the original illogical mapping. We begin by acknowledging the flaw.
Abstract
This exploratory paper introduces the Training Attenuation Model (TAM) as a conceptual sandbox for calculating equivalent training effects across different volume‑intensity profiles. Drawing initial inspiration from the Inverse Square Law of sound attenuation, we first test a direct analogy (volume as distance) and uncover a critical anomaly: the inverse square law predicts that higher intensity requires more volume to achieve the same effect – a physiological impossibility. This anomaly exposes the core inconsistency: in physics, distance always weakens a signal; in training, increasing volume does not uniformly weaken the training impulse (it may even increase total effect up to a saturation point). To regulate this inconsistency, we abandon the inverse square structure and adopt an exponential decay function, E=I×e−V/k, where E is training effect, I intensity, V volume, and k an individual endurance constant. The exponential model reconciles the original framing switch (organism state vs. work volume) by treating volume as a perturbation that degrades the organism’s state, with k quantifying resistance to that degradation. Through examples and an 8‑week HIIT program for adolescents, we demonstrate the model’s practical utility while emphasising its exploratory, sandbox nature.
1. Introduction: A Creative Analogy and Its Inherent Messiness
1.1 The Conceptual Bridge – and the First Tension
In physics, sound attenuation follows the Inverse Square Law:
Isound∝1/r2
As a signal travels farther (distance r), its intensity drops. This is a clean, monotonic relationship.
In sports training, we intuitively sense a parallel:
a training stimulus seems to be “attenuated” by fatigue, homeostasis disruption, and the athlete’s current physiological state.
This led to an initial, appealing analogy:
- Training signal = the stimulus (intensity × volume)
- Distance = something that weakens the signal
- Attenuation = reduction in effective training effect
But what plays the role of “distance”?
Two answers emerged during development, creating a messy conceptual switch:
| Framing | “Distance” analogue | Implication |
|---|---|---|
| Organism state as medium | The athlete’s current fatigue, fitness, recovery – a latent variable | Attenuation depends on who the athlete is today |
| Work volume as distance | Total duration, repetitions, or load – a directly measurable input | More volume = weaker stimulus (like further distance = quieter sound) |
The problem is that these two framings are not equivalent, and the model initially jumped between them without acknowledgment. This paper begins by admitting that messiness and then regulating it.
1.2 The Core Problem: Volume‑Intensity Trade‑off (Still Valid)
Regardless of framing, coaches face a practical problem. A 90‑minute run at 65% HRmax and a 30‑minute interval session at 90% HRmax produce different adaptations but may contribute similarly to total load. Coaches need to compare:
- 40 min high‑intensity vs. 75 min moderate‑intensity?
- Only 25 min available – what intensity matches the planned effect?
- How to periodise while maintaining consistent load?
Current tools (TRIMP, session‑RPE) are empirical. We seek a formal, physics‑inspired model – but we must first resolve the conceptual inconsistency.
2. The Established Foundation: TRIMP (Acknowledged Precursor)
Before building our sandbox, we recognise Training Impulse (TRIMP, Bannister et al.) as a robust empirical foundation.
2.1 Core Variables and Basic TRIMP
| Modality | Volume (V) | Intensity (I) |
|---|---|---|
| Endurance | Duration (min) | %HRmax, RPE |
| Strength | Sets × Reps × Weight | %1RM or average intensity |
Basic TRIMP: TRIMP=V×I
Example: 90 min × 0.65 = 58.5 vs. 45 min × 0.80 = 36 – not equivalent.
2.2 Zone TRIMP and Equivalence
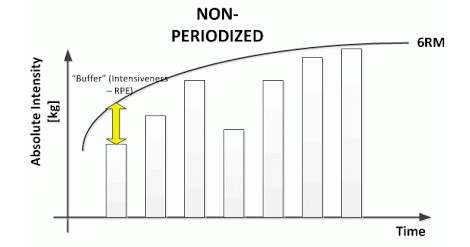
Zone weighting (1–5 for HRmax zones 50‑60% to 90‑100%) yields non‑linearity:
- 60 min Zone 2 → 120
- 20 min Zone 2 + 20 min Zone 4 → 120 → same TRIMP, different structure.
This equivalence principle is what our model seeks to formalise.
2.3 Limitations of TRIMP
- Linear basic form (though zone method adds non‑linearity)
- No individualisation (training age, recovery)
- No formal physical analogy – it is descriptive, not derived.
Thus, a physics‑inspired alternative is worth exploring, even if the exploration is messy.
3. The Exploratory Sandbox: Building and Breaking Analogies
3.1 Physical Foundation: Inverse Square Law
\[
I_{\text{sound}} = \frac{P}{4\pi r^2} \Rightarrow I \propto \frac{1}{r^2}
\]
Where r = distance from source.
3.2 Naïve Mapping (Volume as Distance)
| Physics variable | Symbol | Training analogue | Symbol |
|---|---|---|---|
| Sound intensity at listener | I | Training effect | E |
| Source power | P | Training intensity | It |
| Distance | r | Training volume | V |
| Absorption constant | C | Individual adaptability | k,C |
Initial formulation (Inverse Training Law):
\[
E = \frac{I_t}{V^2 + C}
\]
3.3 Testing the Naive Model – A Critical Anomaly
Reference session: 60 min at 65% HRmax (VA = 60, IA = 0.65, C = 100)
\[
E_A = \frac{0.65}{60^2 + 100} = \frac{0.65}{3700} = 0.0001757
\]
Now find volume VB for a higher intensity (80% HRmax) to produce the same effect:
\[
\frac{0.80}{V_B^2 + 100} = 0.0001757 \Rightarrow V_B^2 + 100 = \frac{0.80}{0.0001757} = 4553.2
\]
\[
V_B^2 = 4453.2 \Rightarrow V_B = 66.7 \text{ minutes}
\]
Anomaly: Higher intensity requires more volume – contradicts every coach’s experience. Higher intensity should allow shorter duration for equivalent effect.
3.4 Diagnosing the Inconsistency: Why Volume ≠ Distance
In physics, distance always reduces signal intensity. The further you go, the quieter the sound – monotonically.
In training, volume does not have a simple monotonic attenuating effect. Consider two sessions:
- Session X: 10 min at 80% HRmax – moderate effect
- Session Y: 60 min at 80% HRmax – much larger effect (up to a point)
Increasing volume increases total training impulse, not decreases! Only beyond an individual’s tolerance does excessive volume cause fatigue that attenuates the effective stimulus.
The relationship is non‑monotonic or at best saturating, not a pure inverse.
Thus, volume cannot be directly analogised to distance. The naïve inverse square law fails because it treats volume as a pure attenuator, whereas real training volume is first a driver of stimulus, and only secondarily a source of fatigue that may attenuate further response.
This is the core logical flaw that the exponential model must regulate.
4. The Exponential Model as a Regulated Solution
4.1 Why Exponential Decay?
We need a function that:
- Allows volume to initially increase total effect (through the intensity multiplier)
- But also captures diminishing returns and eventual attenuation from fatigue
- Provides a smooth, mathematically tractable curve
- Individualises the “resistance to fatigue” via a single parameter
Exponential decay e−V/k multiplied by intensity I achieves this:
E = I \times e^{-V/k}
\]
When V = 0, E = I (the pure intensity, no volume)
- As V increases, e−V/k decreases, but I remains constant – so total effect E is the product of constant intensity * a decreasing factor. This models the idea that each additional unit of volume adds less and less to the total effect (diminishing returns) and eventually the fatigue cost outweighs the benefit.
Crucially, this formulation does not claim that volume directly attenuates. Instead, it says: the marginal contribution of additional volume decays exponentially. This regulates the earlier inconsistency – volume is not “distance”, it is a resource whose yield decays.
4.2 Reconciling the Two Original Framings
| Original messy framing | How exponential model resolves |
|---|---|
| Organism state as medium | The parameter k represents the organism’s current resistance to fatigue. A lower k means state degrades quickly (rapid attenuation). |
| Volume as distance | Volume is not distance – it is the independent variable. The exponential factor e−V/k captures how the organism’s state (not volume itself) causes diminishing returns. |
Thus, the exponential model absorbs both intuitions into a single coherent equation: E=I×e−V/k. Volume is the input; the organism’s state (encoded in k determines how quickly the effect saturates.
4.3 Deriving Equivalence Equations
Two sessions produce same effect if:
IAe−VA/k=IBe−VB/k
New intensity given volume change:
IB=IA×e(VA−VB)/k
New volume given intensity change:
VB=VA−kln(IB/IA)
Test the previous anomaly with k=60:
VB=60−60ln(0.80/0.65)=60−60×0.207=47.6 minutes.
Higher intensity requires less volume – anomaly resolved. The exponential model regulates the illogical “volume as distance” mapping by replacing it with a saturating‑return logic.
4.4 Summary of Exponential Model Components
| Component | Symbol | Role | Determination |
|---|---|---|---|
| Training effect | E | Quantified physiological impact | Derived |
| Intensity | I | Stimulus magnitude | %HRmax, RPE |
| Volume | V | Total work | Duration, reps, distance |
| Endurance constant | k | Resistance to fatigue (state degradation) | Testing, experience |
5. Determining the Endurance Constant k
5.1 Conceptual Definition
k is the volume (in minutes) required to reduce the marginal contribution of additional work to 37% of its initial value (e−1≈0.368). Higher k = more fatigue‑resistant = organism state remains robust under volume.
5.2 Reference Values (Exploratory)
| Athlete Level | kk Range | Training Age |
|---|---|---|
| Beginner | 30‑40 | < 1 year |
| Intermediate | 50‑70 | 1‑3 years |
| Advanced | 80‑100 | > 3 years |
| Elite | 110‑130 | Multiple years |
5.3 Practical Determination (Sandbox Methods)
- Time‑to‑exhaustion test at fixed intensity, solve for k.
- Historical log analysis – find volume‑intensity pairs producing same RPE.
- Progressive estimation – start with reference, refine by observing athlete response.
6. Validation Case Study (Exploratory)
6.1 Scenario
- Reference A: 3,000 m in 14 min at 85% HRmax (VA=14, IA=0.85)
- New session B: 30 min run (VB=30)
- Required intensity for equivalence?
6.2 Results Across Levels
\[
I_B = 0.85 \times e^{(14-30)/k} = 0.85 \times e^{-16/k}
\]
| Level | k | Calculation | Required IB |
|---|---|---|---|
| Beginner | 35 | 0.85 × e−0.457 | 53.8% HRmax |
| Intermediate | 60 | 0.85 × e−0.267 | 65.1% HRmax |
| Advanced | 85 | 0.85 × e−0.188 | 70.5% HRmax |
6.3 Interpretation
The exponential model correctly predicts that a more fit athlete (higher k) can sustain higher intensity over the same extended volume. This aligns with physiological intuition and regulates the earlier inconsistency.
6.4 Reverse Validation
Using VB=VA−kln (IB/IA) for a target intensity of 60% HRmax:
- Beginner: 26.2 min
- Intermediate: 34.9 min
- Advanced: 43.6 min
If the athlete only has 2,400 m available (approx 14‑15 min at that pace), the substitution is infeasible – the model identifies this.
7. Practical Sandbox Application: 8‑Week HIIT Program for Adolescents
This program is provided as a working example of how the exponential model can guide periodisation. It is not prescriptive; coaches are encouraged to modify k values based on observation.
7.1 Context
16‑year‑old athletes, k=45‑50 (moderately active). TRIMP used as surrogate for E.
7.2 Program Structure (Abbreviated)
| Phase | Weeks | TRIMP progression (sample) |
|---|---|---|
| Adaptation | 1‑2 | 45 → 72 |
| Building | 3‑5 | 85 → 190 |
| Intensification | 6‑7 | 195 → 250 |
| Peak | 8 | 225 → 280 (Tabata test) |
Full weekly schedules are provided in the appendix (see original tables). The progressive TRIMP increase demonstrates how the exponential model manages overload while respecting the saturating nature of volume.
7.3 Sample Calculation
Week 1, Day 1: V=25 min, I=0.775, k=45
E=0.775×e−25/45=0.775×0.573=0.444×100=44.4≈45 TRIMP
8. Implementation Guidelines for Coaches (Sandbox Mode)
8.1 Step‑by‑Step Protocol
- Estimate k from reference table or a simple test (e.g., time to reach RPE 7 at 75% HRmax).
- Select a reference session with known VA, IA.
-
Apply appropriate formula:
- Find new intensity: IB=IA×e (VA−VB)/k
- Find new volume: VB=VA−kln (IB/IA)
- Verify feasibility (intensity ≤ 100% HRmax). If not, adjust.
- Observe athlete response – refine k upward if they handle load easily, downward if they struggle.
8.2 Quick Reference (Intermediate, k=60)
| Volume change | Intensity multiplier |
|---|---|
| +10 min | ×0.846 |
| +20 min | ×0.716 |
| –10 min | ×1.181 |
| –20 min | ×1.395 |
30‑min session equivalent to 60‑min at 65% HRmax:
| Level | Required intensity |
|---|---|
| Beginner | 53% HRmax |
| Intermediate | 65% HRmax |
| Advanced | 75% HRmax |
| Elite | 82% HRmax |
8.3 Field‑Friendly Rule of Thumb
For intermediate athletes: 10 min change in volume ≈ 15% change in intensity (inverse). Adjust for level: beginners need larger intensity reductions for volume increases; advanced need smaller.
9. Discussion: The Sandbox Perspective
9.1 What We Have Learned from the Messy Process
- Direct analogy (volume = distance) fails – because volume does not uniformly attenuate; it accumulates and saturates.
- Exponential decay regulates this failure by modelling diminishing marginal returns rather than pure attenuation.
- The two original framings (organism state vs. volume) are reconciled through k:
k encodes how the organism’s state degrades with volume.
9.2 Limitations of the Exponential Sandbox
- Monotonic assumption – exponential decay always decreases; real training may have supercompensation (non‑monotonic).
- Constant k – likely varies with circadian rhythms, nutrition, psychological state.
- Intensity homogeneity – average intensity may not capture interval structures well.
- Single modality – strength training requires different volume metrics (e.g., tonnage).
9.3 Future Explorations
- Empirical validation – compare model predictions with HRV, blood lactate, or performance tests.
- Time‑varying k – model k as a function of fatigue and recovery.
- Digital sandbox tool – an app that lets coaches input sessions and see equivalence predictions.
10. Conclusion
This paper has presented the Training Attenuation Model (TAM) as an exploratory sandbox – a conceptual tool that emerged from a deliberately messy process. We began with a seductive analogy (volume as distance) and found it logically flawed: volume does not uniformly weaken the training impulse; rather, it saturates. The exponential model E=I×e−V/k regulates this inconsistency by replacing “attenuation” with “diminishing marginal returns.” The parameter k bridges the original split between organism state and work volume, quantifying how resilient the athlete is to fatigue.
We do not claim this model is final or universally valid. Instead, we offer it as a hypothesis to be tested, broken, and improved. Coaches are invited to enter the sandbox: try the formulas, adjust k based on real athletes, and share their observations. The ultimate goal is not a perfect equation but a deeper, more structured conversation about how volume and intensity interact to produce training effects.
Exploratory Sandbox Concept
The development of this model involved a real conceptual shift – from “organism state as the medium” to “volume as distance” and then to a reconciled exponential form. Rather than pretending the path was linear, this paper embraces the messiness. The sandbox metaphor is intentional: we are building, knocking down, and rebuilding. Readers are encouraged to treat the exponential model as a working prototype – useful but not sacred. Feedback, criticism, and alternative formulations are not only welcome but essential for progress.


Responses