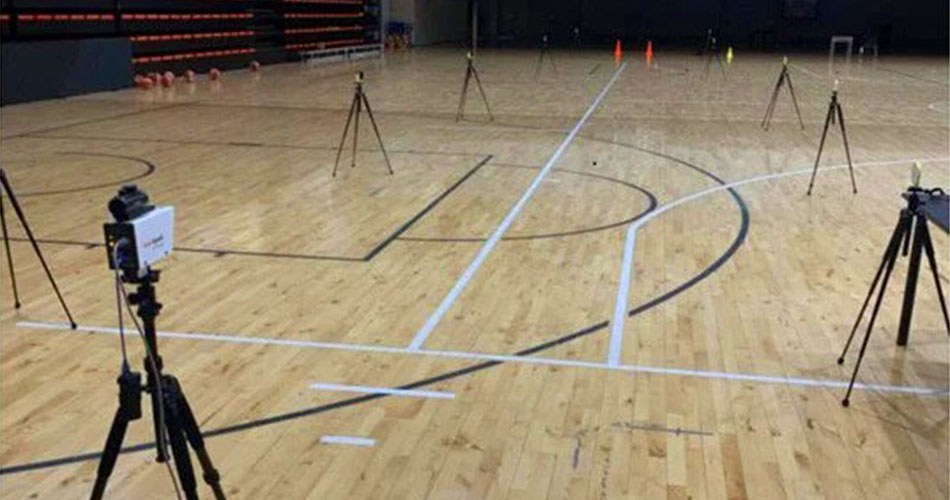
The Optimal Timing Gate Placement for Obtaining the Most Reliable and Sensitive Acceleration-Velocity Profile: A Simulation Study
Introduction
I have explored the bias and sensitivity of the acceleration-velocity profiles (AVP) of the short sprints due to the flying start involved using the timing gates in recently published papers (Jovanović 2023; Jovanović et al. 2024) as well as in my PhD thesis. Besides using a common mono-exponential model (called the No correction model) I have also create few more models: time-correction, distance correction, time and distance correction, and flying distance correction models (the best overview would be to check this article series).
Overall, \(MSS\) parameter (maximum sprinting speed) was the parameter that showed highest sensitivity and the the best agreement, while \(MAC\) (maximum acceleration) was toughest to estimate validly and provide good enough sensitivity. Interestingly, in the simulation study (Jovanović 2023), the No correction model actually showed highest sensitivity for the \(MAC\) parameter, while in the study involving real athletes (Jovanović et al. 2024), the No correction model showed the highest sensitivity to detect changes in \(MSS\) parameter, while providing biased estimates.
Both studies (Jovanović 2023; Jovanović et al. 2024) involved timing gates positioned at 5, 10, 20, 30, 40 and 5, 10, 20, and 30 meters respectively. In Jovanović (2023), the flying distance was varied from 0 to 0.5 meters, while in Jovanović et al. (2024), the flying distance was set to 0.5-meters.
Methods
The purpose of this exploratory study, was to extend the analysis of the model behavior when estimating AVP, but now with different number and distance positions of the timing gates while utilizing fixed 0.5-meters flying distance.
The simulated parameters involved \(MSS\) ranging from 5 to 11 \(ms^{-1}\) (total number 50), \(TAU\) ranging from 0.7 to 1.3 \(s\) (total number 50), yielding \(MAC\) from 3.84 to 15.71 \(ms^{-2}\) (with some of it being over-natural). In total, there was \(50 \times 50\) or 2,500 combinations of true parameter values.
Flying distance was set to 0.5-meter and the simulated split times were rounded to closest 2 digits (i.e., 10 \(ms\)). This simulated rounding error of the measurement. Example of this process is enisted in Table 1.
| sprint_distance | sprint_time | distance | time |
|---|---|---|---|
| 5.5 | 1.67471 | 5 | 1.24 |
| 10.5 | 2.53369 | 10 | 2.10 |
| 20.5 | 4.05927 | 20 | 3.63 |
| 30.5 | 5.51347 | 30 | 5.08 |
| 40.5 | 6.94936 | 40 | 6.52 |
Table 1: Example split times for \(MSS\) of 7 \(ms^{-1}\) and \(MAC\) of 6 \(ms^{-2}\) when using using 0.5m flying distance. Columns sprint_distance and sprint_time represent true distance and time, while columns distance and time (which is also rounded to closest 10 \(ms\)) represent measured variables.
Simulation involved 34 different timing gates setup (Table 2). The following models were used to estimated \(MSS\) and \(MAC\) from simulated splits times: (1) No correction, (2) Estimated Time correction (TC), and (3) Estimated Flying Distance correction (FD).
| 3 gates | 4 gates | 5 gates |
|---|---|---|
| 10, 20, 30 | 10, 20, 30, 40 | 5, 10, 20, 30, 40 |
| 10, 20, 40 | 5, 10, 20, 30 | 2.5, 5, 10, 20, 30 |
| 10, 25, 40 | 2.5, 5, 15, 30 | 2.5, 5, 10, 20, 40 |
| 5, 15, 30 | 2.5, 5, 20, 40 | 1, 2.5, 5, 10, 20 |
| 5, 10, 30 | 2.5, 5, 10, 30 | 1, 2.5, 5, 10, 30 |
| 5, 10, 40 | 1, 2.5, 5, 20 | 1, 2.5, 5, 10, 40 |
| 5, 20, 40 | 2.5, 5, 30, 40 | 1, 2.5, 5, 15, 30 |
| 2.5, 10, 30 | 2.5, 5, 25, 30 | 1, 2.5, 5, 20, 40 |
| 2.5, 5, 20 | 2.5, 5, 35, 40 | 1, 2.5, 5, 30, 40 |
| 2.5, 5, 30 | 1, 2.5, 30, 40 | 1, 2.5, 5, 20, 30 |
| 1, 2.5, 35, 40 | 1, 2.5, 5, 25, 30 | |
| 1, 2.5, 25, 30 | 1, 2.5, 5, 35, 40 |
Table 2: Simulated timing gates positions
The agreement between true and estimated \(MSS\) and \(MAC\) was done simply by calculating percent difference score (\(\%Diff\)) and its distribution (Equation 1), which was aggregated using \(mean\) and 95% quantiles, as well as percent absolute mean difference (\(\%MAD\)) (Equation 2).
\[
\%Diff = 100 \times \frac{estimated – true}{true}
\tag{1}\]
\[
\%MAD = \frac{ \sum_{1}^{N} |\%Diff_i – \overline{\%Diff}| }{N}
\tag{2}\]
Practitioners are frequently concerned about whether they may utilize estimated parameter values to monitor changes in the true parameters in addition to estimating agreement between them. Thus, an estimate of the sensitivity represents a piece of crucial information to decide whether a given measure can be practically used to monitor changes. A minimal detectable change estimator with 95% confidence (\(\%MDC_{95}\)) was utilized to estimate this sensitivity (Jovanović 2023; Jovanović et al. 2024). The \(\%MDC_{95}\) value might be regarded as the minimum amount of change that needs to be observed in the estimated parameter for it to be considered a true change.
Percent residual standard error (\(\%RSE\)) of the linear regression between true (predictor) and estimated parameter values (outcome) (Equation 3) was utilized to calculate \(\%MDC_{95}\) (Equation 4). Since simulated data with the known true values were utilized, \(\%RSE\) represents the percent standard error of the measurement (\(\%SEM\)) in the estimated parameters.
\[
\%RSE = \sqrt{\frac{\sum_{i=1}^N{(100 \times \frac{y_i – \hat{y_i}}{\hat{y_i}})^2}}{N-2}}
\tag{3}\]
\[
\%MDC_{95} = \%RSE \times \sqrt{2} \times 1.96
\tag{4}\]
No statistical inference was performed, since the true parameter values were known.
Results
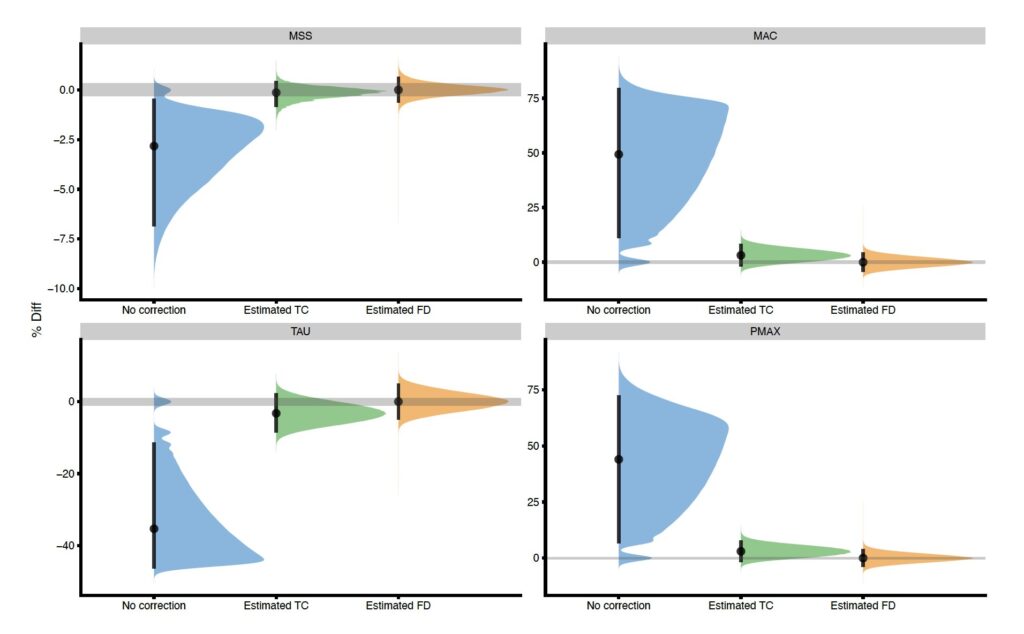
Percent difference
Distribution of the percent difference (\(\%Diff\)) between estimated and true parameter values (i.e., \(MSS\) and \(MAC\)), summarized using mean and 95% quantiles are depicted in Figure 1.


Responses