Playing With Statistics [Part 3]
After a general rant in part 1 and part 2 I am about to start actually doing some stats.
Ok, the first 30-15IFT test we did was in January and here are the scores.
| TEST | |||
|---|---|---|---|
| Player | v30-15IFT | Z-Score | |
| 1 | 19,5 | -0,89 | |
| 2 | 19 | -1,57 | |
| 3 | 19,5 | -0,89 | |
| 4 | 20,5 | 0,45 | |
| 5 | 19,5 | -0,89 | |
| 6 | 20 | -0,22 | |
| 7 | 21 | 1,12 | |
| 8 | 21,5 | 1,79 | |
| 9 | 21 | 1,12 | |
| 10 | 19,5 | -0,89 | |
| 11 | 19,5 | -0,89 | |
| 12 | 19,5 | -0,89 | |
| 13 | 20,5 | 0,45 | |
| 14 | 20 | -0,22 | |
| 15 | 21,5 | 1,79 | |
| 16 | 20 | -0,22 | |
| 17 | 21 | 1,12 | |
| 18 | 20 | -0,22 | |
| Mean | 20,17 | 0,00 | |
| SD | 0,75 | 1,00 | |
| Min | 19,00 | -1,57 | |
| Max | 21,50 | 1,79 | |
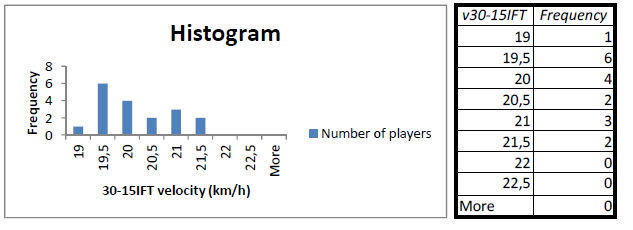
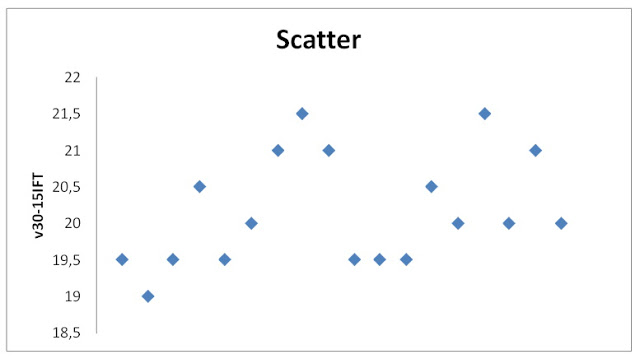
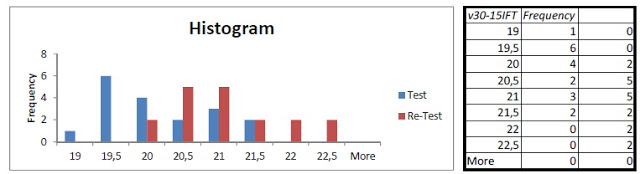
As you can see from the table I have calculated Mean and Standard Deviation. Z-score (or standard score) for each athlete is the number that shows how many standard deviations players score is above/below mean value. Having 0 in z-score is equal to mean value of the group. Standard score is great because it take variability of the group scores into account, yet again this might present a problem since some outliers can skew the score by shifting the distribution. This skewness stuff can be calculated too and it deals with normal distribution. Again I am not an expert on this. Anyway, here are the histogram and scatter gram of the scores.
Standard score is great for comparing the athletes and creating the rankings. Here is the graph of Z-scores of the player.
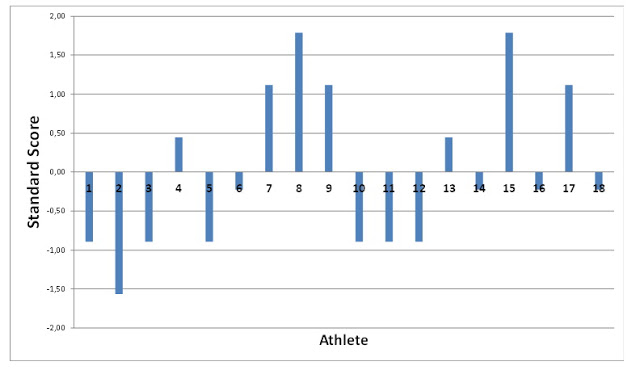
Now it is easier to identify outliers or guys who are above/below 1SD or 2SD or whatever (which one to choose is beyond my statistic knowledge at the moment). This might guide training prescriptions for certain athletes. For example guys with Z-Score below -1 can/should do more conditioning volume (and less intensive due their lower v30-15 score which I use to determine running intensity in the intervals). After some time we can see how they respond to training (this will be covered later) and identify responders vs. non-responders and thus give some feedback to planning/programming process and individualization of training loads in general.
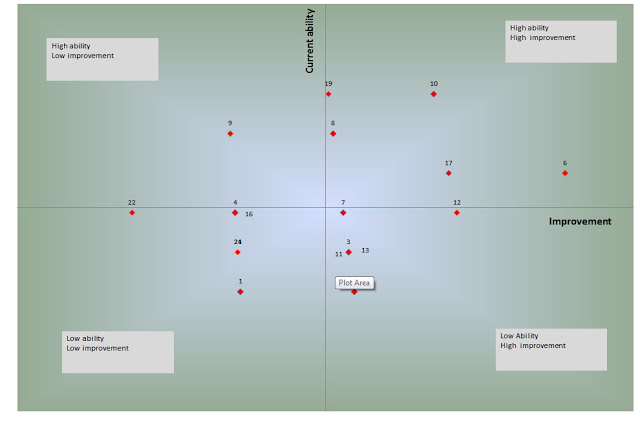
Basically we can group those players in four major groups:
| Low initial score, low training response | Low initial score, high training response |
| High initial score, low training response | High initial score, high training response |
Based on this we can judge on talent of certain players regarding certain quality. But we still lack one parameter that it is hard to measure and that is the ceiling, but this is beyond this article.
It would be interesting to see the distribution of the athletes in these 4 quadrants over time. Again this might help with the training prescription and individualization within team sport.
If we create z-scores for more than one physical quality (like sprint time, broad jump, % of body fat, etc) we can create spider graph for each player. Here is an example of spider chart from Marco Cardinale’s blog.
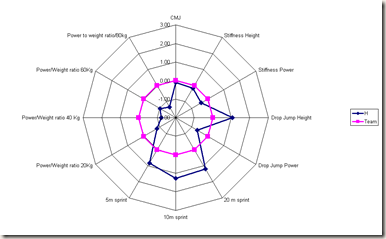
The spider graph can be based on Z-score if we want to compare the player to the team average, or it could be based on absolute values if we want to compare it to a certain model of player or certain test standards (make sure to check BioForce by Joel Jamieson). Again, this can guide us with training prescription and individualization.
Another interesting graph could be equalizer. I got this idea from Marco’s blog.
![New Picture (3)_thumb[2]](http://complementarytraining.net/wp-content/uploads/2012/03/New-Picture-3_thumb2.png)
To summarize. In this part I covered some basic descriptive statistics of static score (one test). In the next installment I will cover re-test and the statistical analysis of the change and will probably create a 4 quadrant’s graph. Until then check the links posted. Stay tuned…


Responses