Player profiles Dashboard – Template
At the moment I am working on an Excel database and dashboard for tracking performance and screening data and creating a player profiles (dashboards).
Theoretically, this should help me devise individualized training focus (does this guys need more core work, more mobility, speed, etc… how is he ranking to other guys… did he improved since last testing[1]?).
What I am struggling with at the moment is the connection between database (Excel sheet) and dashboard. I am trying to code a VBA solution to allow me flexibility and speed so I can quickly pull the data from the database and visualize it (hopefully without posting it in the range 🙂 ).
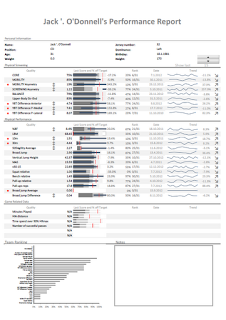
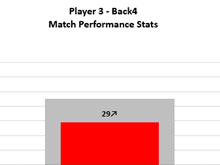
I am posting the picture of the dashboard (template). I’ve used Stephen Few bullet graphs and basic line graph for trend/history. If anyone has any idea how to make this better – more readable, more understandable, better visualization – please let me know.
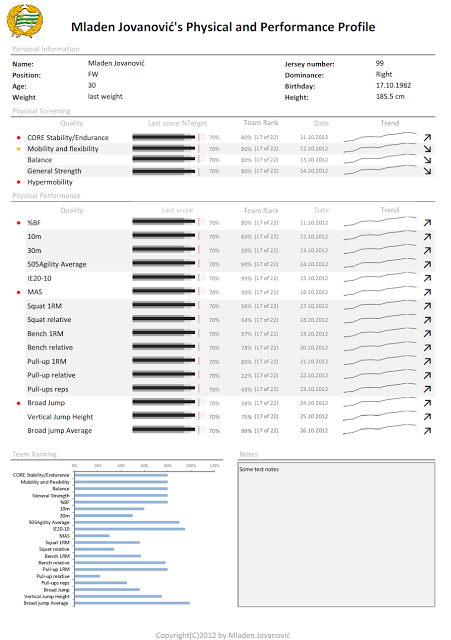
Mladen’s dashboard template
[1] Judging how much someone improved from performance test is my next project. The work by Will Hopkins and the new book by AIS should provide a lot of data and starting point.


Responses