How to Visualize Test Change Scores for Coaches [Part 2]
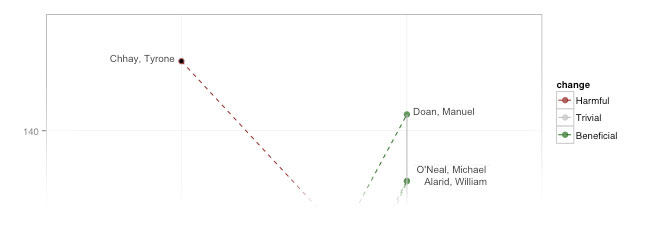
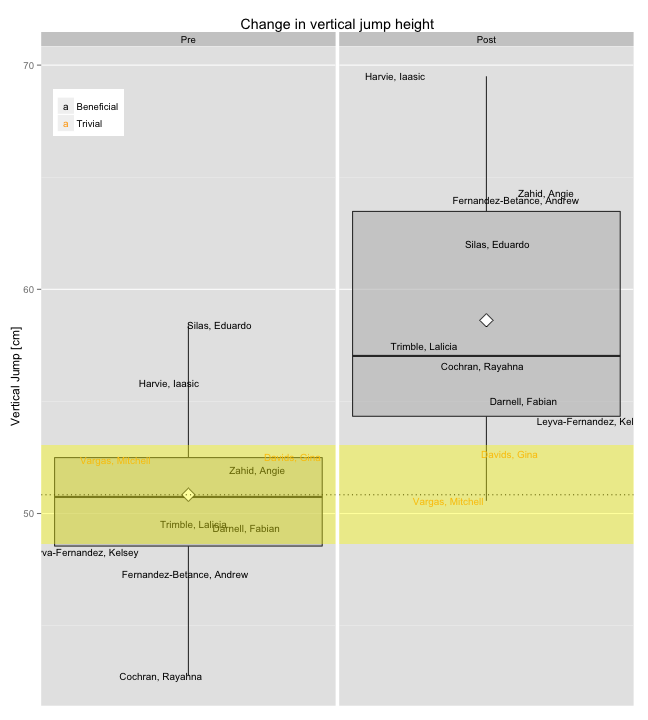
To continue the previous How to visualize test change scores for coaches post, here is another way to visualize individual change scores without falling for group averages. This way we can easily see individual ranks in both pre- and post- test, along with change score (which is also color coded). Quite easy to identify the outliers.
Orange rectangles represent group averages.


Responses