How to Analyze Training Load and Monitoring Data?
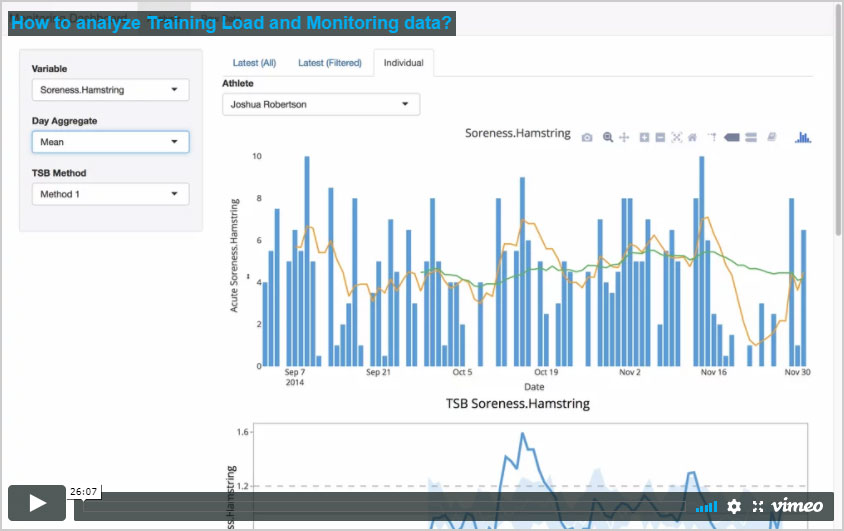
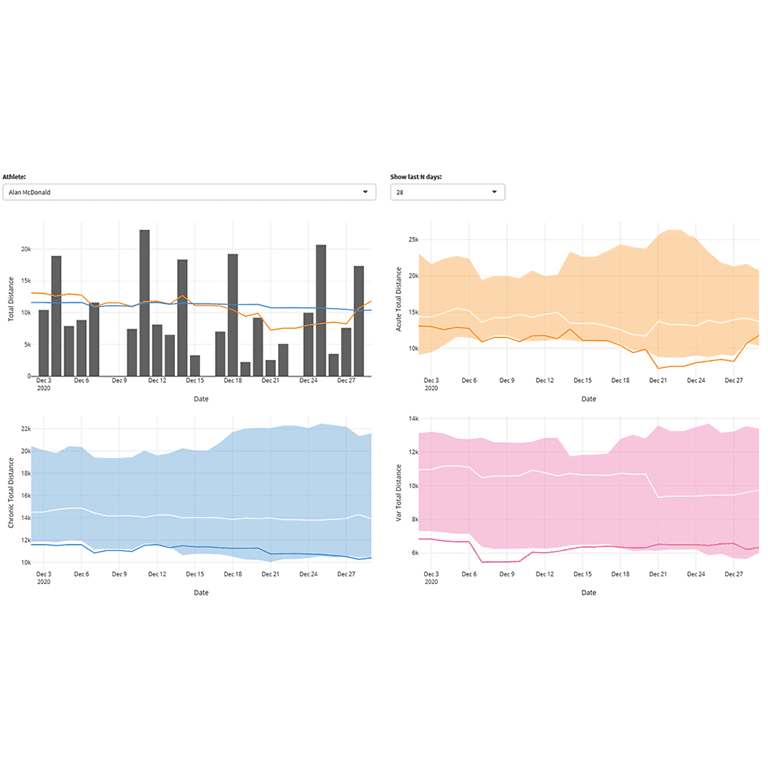
In the video below, I am sharing my viewpoints, as well as the dashboard I’ve built in Shiny, regarding how to make sense of longitudinal training load and monitoring data.
I am explaining two methods to deal with missing values and why you should pay attention to the way you are aggregating data (daily, team averages, body soreness, etc). If you don’t pay attention to these issues you might make big errors, so it is worth checking out what to do to avoid them.
You can access the dashboard HERE.
Video and source code are available for Complementary Training members. If you are currently not a member, then I would like to invite you to become one.


Responses