Player and Test Report/Dashboard
During the last couple of weeks I have been reading a lot on VBA (Visual Basic for Applications) for Excel since I haven’t found PivotTable enough to fulfill my needs. Luckily I have a programming background (yup, a nerd – been using Qbasic, C/C++, MATLAB and Assemblerduring the days of 486) so I had the basic skills and all I needed were various tricks and techniques. So what was the problem so I needed VBA? Well, most of the databases are organized in the following way:
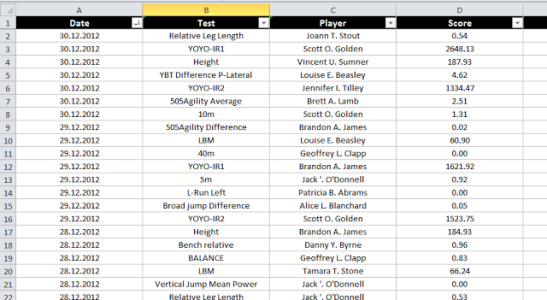
What you do basically, is write down all the players you have in a named range, along with tests (or things you track) and then organize the database in the manner showed above.
When you test a player, you write down the date, the test you did, player’s name and score. Pretty simple, right?
Using Pivot Table you can quickly and neatly summarize the data using filters (might be test and/or dates). In the following picture I utilized Pivot Chart and used Date and Test as Filters.
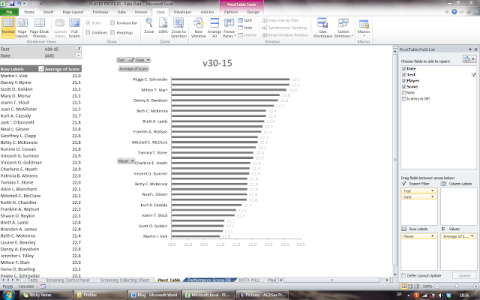
Pivot Table is thus great tool for providing summaries for the databases organized in a way I showed. The problem is that I didn’t want summaries – I wanted to see report/dashboard for each player.
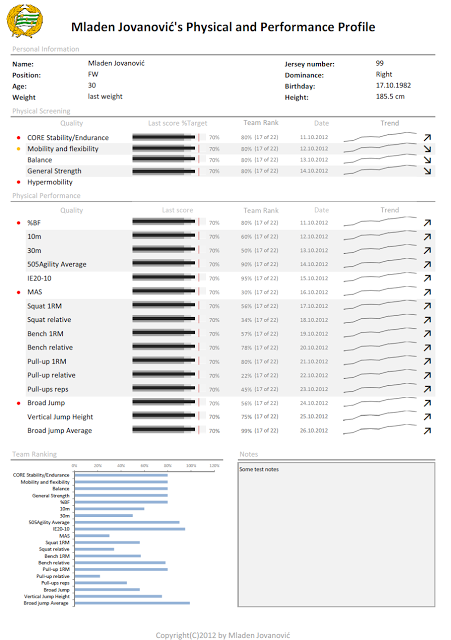
What I wanted to see on one page is:
- basic player info
- last test scores for selected tests, context for those tests (using target, great, average and bad scores, along with red flags for bad scores), which I fulfilled by using bullet graphs (luckily Excel haven’t yet integrate them, so using them was pain in the arse)
- Difference from target score
- Ranking of the test score to other players
- Date of the last test being taken
- Trend of scores
- Change of the compared to the previous test (did the guy improve?)
To do this I had to re-organize the database (DB) to a following format, so I could use named ranges and dynamic graphs. I needed to organized DB into the following format:
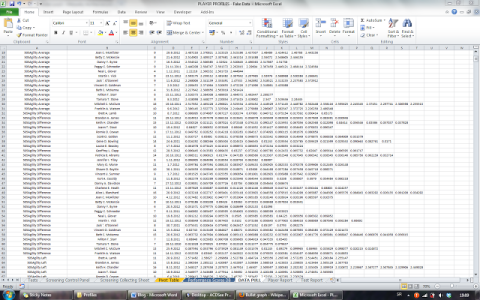
The basic format for this database is Test Name, Player, Number of Entries, Date of the last test, and test scores going from last to the first. Organized this way, I was able to use DB for reporting and plotting really easy using custom functions in VBA or INDEX and MATCH formulas.
Anyway, last couple of days I was struggling to write a code to convert first database into second. First one I wrote was damn slow, but in the second one I used faster cell (or range for those with Excel VBA knowledge) reading and faster algorithm (without referring to famous Sedgewick book 🙂 ), along with basic user interface.
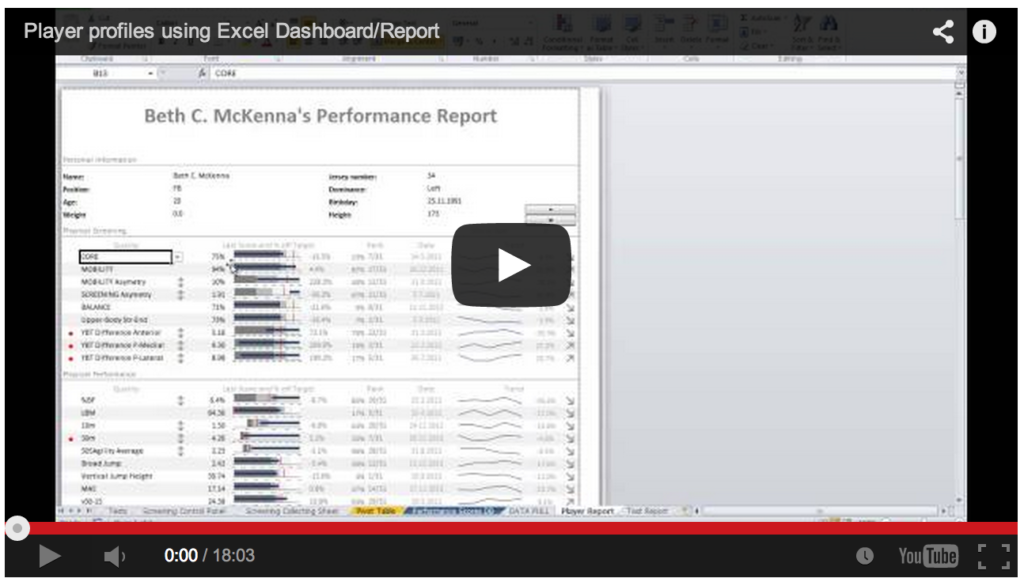
After this was done I was finally able to create report/dashboard page for both Player and Test.

Player Dashboard/Report
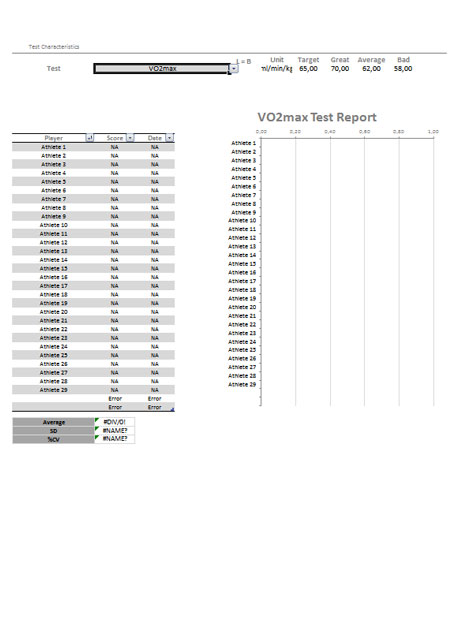
Test Dashboard/Report
Now it is easy to select a player and all the data is pulled automatically. You can also choose which test you want to visualizein each slot.
Couple of problems I had with visualization was creation of bullet graphs, and visualizing and quantifying negative tests.
What I refer under negative test are the type of tests where lower equals better (like 10m sprint, 1500m time trial, asymmetries between legs), compared to tests where higher equals better (relative strength, MAS, YOYO distance). Visualizing them was also problematic, but I choose inverted/negative bullet graph for that too.
It was important to warn the user about those tests, so I used ↕ symbol. When it comes to change in time (trend) having this test dropping down is also a good thing. Ranking was easy to solve (the lower the score the higher your ranking) by simply subtracting the score from 1. I am still looking for a better and more intuitive way to visualize the data, so the coaches know what they are dealing with and a immediately able to spot trends, strength and weaknesses and devise action plans. If you have any tip let me know in the comments.
Complementary Training members can find and download the Excel workbook below. The Player Profiles was a product before, but I removed it since Annual Planner for Sports took all of it’s features.


Responses