A Retrospective Examination of Machine Learning (ML) Techniques for Predicting Cycle Ergometer Peak Performance in a Clinical Setting of Cancer Survivors
Introduction
Cancer patients face numerous challenges, including the loss of physical performance due to the disease and its treatments. For example, lung resection is associated with a reduction of 12-20% in peak oxygen saturation of working muscles 1, while certain tumors 2, 3 or chemotherapies 4 are known to cause skeletal myopathy that can result in leg muscle weakness and exercise failure. In contrast, certain chemotherapies, as well as targeted or immunologic therapies, may trigger peripheral vascular toxicities, such as systemic hypertension, pulmonary hypertension, thrombosis, and stenosis 5. According to the International Agency for Research on Cancer (IARC), a crude estimate of new cancer cases in 2020 was over 19 million and almost 10 million cancer deaths worldwide 6. The beneficial impact of physical exercise on cancer patients, from the time of diagnosis through survivorship and beyond, is widely acknowledged and recognized 7, 9. However, in order to attain the advantageous effects of exercise in individuals with cancer, it is essential for an exercise specialist to create a customized exercise program that is tailored to meet individual-specific needs. This requires consideration of various factors, including the underlying pathophysiology of cancer, any potential comorbidities, past injuries, and current level of physical fitness. However, one of the initial stages in this process involves conducting clinical exercise testing (CET). The primary objective of CET is to furnish comprehensive information concerning the physical performance and capabilities of the subject. Traditional methods of assessing physical performance in the clinical domain, such as the 6-minute walk test and hand grip strength test, are not objective enough and may not be accurate in predicting physical performance, especially in cancer patients. In recent years, there has been a growing interest in sports therapy interventions for individuals diagnosed with cancer [10, 12]. This interest is particularly evident in the use of fitness assessment tools, designed to monitor and improve the patient’s physical condition.
Machine learning (ML) techniques have promising avenues for predicting physical performance in cancer patients. However, the investigation of ML techniques for accurately predicting maximal physical performance in cancer patients has been surprisingly limited. This article series will explore the use of machine learning techniques for predicting physical performance in cancer patients, with a focus on the methods used and their corresponding results. To address the gaps and deficiencies in the current literature, this series aims to assess and compare the accuracy and prediction performance of several prevalent supervised machine learning (ML) techniques in predicting fitness performance level (FPL) and peak Watt in a retrospective cohort of 1712 cancer patients.
Machine Learning Methods
For the purpose of the analysis two popular ML frameworks were employed. The Scikit-Learn library was employed for the regression and classification models, including LR, SVc, RFc, LogR, SVc, RFc, and NB. Conversely, the Fastai library was utilized for the deep learning model, specifically the TL an CNN1.
|
MODELS |
||
|
Regression |
Classification |
Deep learning (Neural Network) |
|
Linear regression (LR) |
Logistic regression (LogR) |
Convolutional neural network (CNN) |
|
Support vector regressor (SVr) |
Support vector classifier (SVc) |
Tabular learner (TL) |
|
Random forest regressor (RFr) |
Random forest classifier (RFc) |
|
|
|
Naive Bayes (NB) |
|
Table 1
This series of articles will consist of three distinct essays, each focusing on elucidating three distinct types of algorithms, namely regression algorithms, classification algorithms, and deep learning, in sequential order. Prior to delving into regression models, it is essential to provide a comprehensive elucidation of the procedures involved in data processing and data mining. In the realm of data science, the 80/20 principle is widely acknowledged as a heuristic, implying that approximately 80% of the time spent on data analysis is allocated to activities such as data preparation, processing, and data mining procedures, while the remaining 20% (or potentially even less) is devoted to algorithmic work. This principle is grounded in the rationale that in order to circumvent the well-established axiom in statistics regarding the impact of flawed input data leading to erroneous output (garbage in – garbage out), it is imperative to ensure the cleanliness and appropriate preparation of data prior to conducting any analysis.
Subjects
The dataset utilized in this research comprised anonymized anthropometric measurements, as well as information regarding the sex and age of 1712 cancer patients (Table 2).
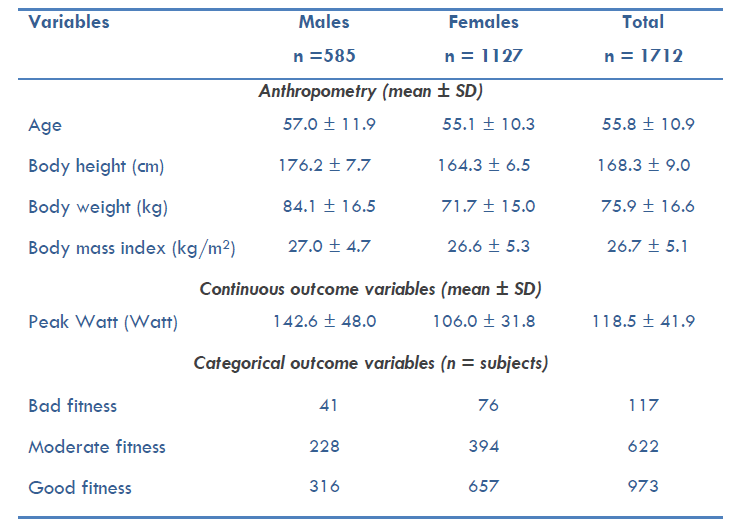
Table 2
The sample consisted of 1127 female individuals and 585 male individuals, with mean ages of 55.1 ± 10.3 and 57.0 ± 11.9, respectively. Furthermore, the body height measurements were recorded as 164.3 ± 6.5 cm and 176.2 ± 7.7 cm, while the corresponding bodyweight measurements were 71.7 ± 15.0 kg and 84.1 ± 16.5 kg, respectively. All subjects included in the dataset had undergone a cycling ergometer test at the rehabilitation clinic between July 2016 and June 2019. This cycling ergometer test is a standardized clinical assessment used to determine the appropriate therapeutic modality for patients based on their level of physical fitness. Prior to analysis, the dataset underwent preprocessing and quality control procedures to identify and exclude erroneous or atypical entries. Subsequently, the dataset was partitioned into training and testing subsets to enable the comparison of various machine learning algorithms. The schematic representation of the detailed workflow adopted in this research is illustrated in the figure below.
Preprocessing and feature engineering
A visual inspection of the dataset was conducted to identify potential inconsistencies and outliers that could indicate errors during data entry. For instance, instances where an individual’s body weight exceeded 200 kg or body height fell below 100 cm were considered indicative of erroneous cross-entry between these attributes. Additionally, the density distribution of all attributes, stratified by sex, was examined (figure below).


Responses