Continuing with Statistical Power simulation in R

In the last blog post I created a simple simulation of statistical power (probability to identify effects when they are really there) calulation depending on the sample size and effect size (Cohen’s D using Will Hopkins effect levels).

Now I will continue with the simulations and create 10 ES (from 0xSD [Baseline group] to 1xSD) levels with sample sizes going from 5 to 100 in 5 increment. We are going to resample 2000x
Related Articles

Statistics 101: Two-Sample Hypothesis Testing

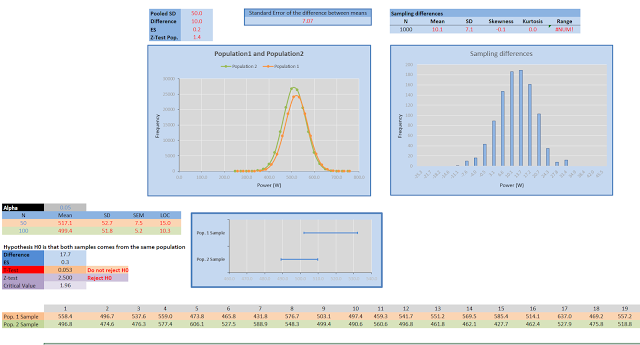
I am slowly going through Statistical Analysis with Excel book and I am making simulation worksheets to understand the concepts. I have created the the worksheet with two populations and two pulled samples to get my mind on standard error of the difference between means which is used in Two-Sample Hypothesis Testing. I have used both Z-Test (when populations…

Responses

Your email address will not be published. Required fields are marked *

Share Your Work with Complementary Training

Got something valuable to share — an article, a tool, or an idea that could help others in the coaching world?

We’d love to see it, share it, and make sure your work gets the recognition it deserves.

Fill out the form below and let’s get started.

Cancel Membership

Please note that your subscription and membership will be canceled within 24h once we receive your request.