Insights from the Serbian National Team Experience Part 4: Training and Match Load Dashboard
In this part of this article series, I will walk you through the training and match load dashboard.
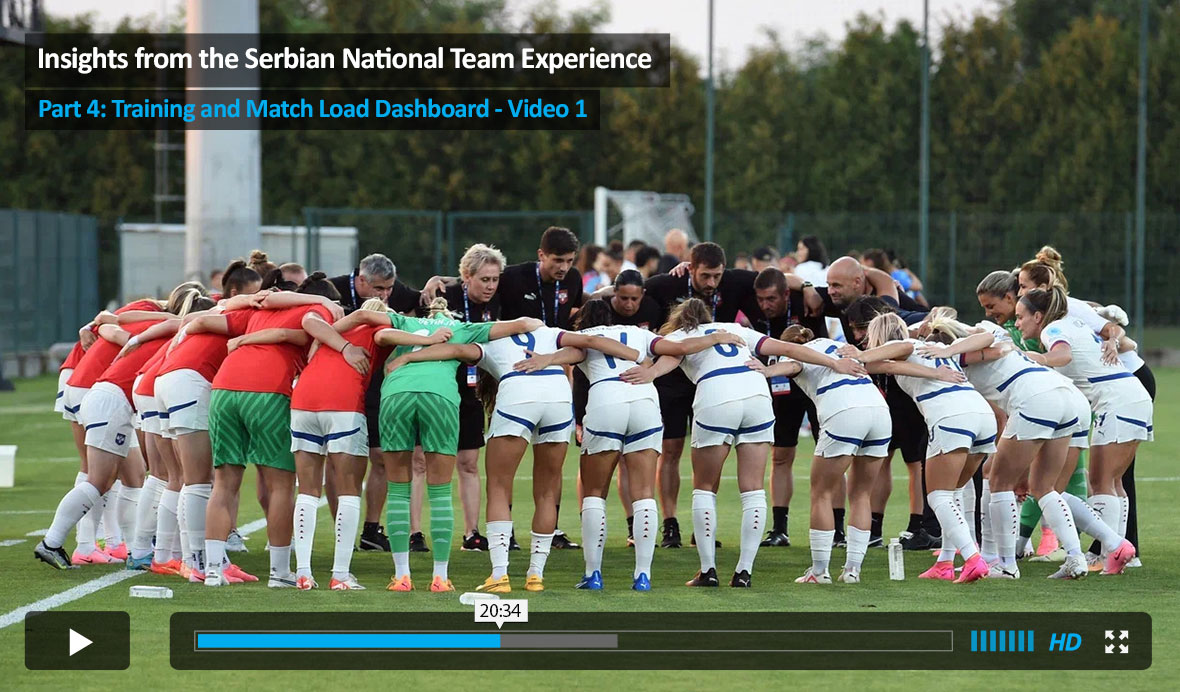
The first video demonstrates the Polar Team Pro GPS that we have at our disposal. It is not perfect (I cover the issues we are facing in the video below), but it is better than nothing.
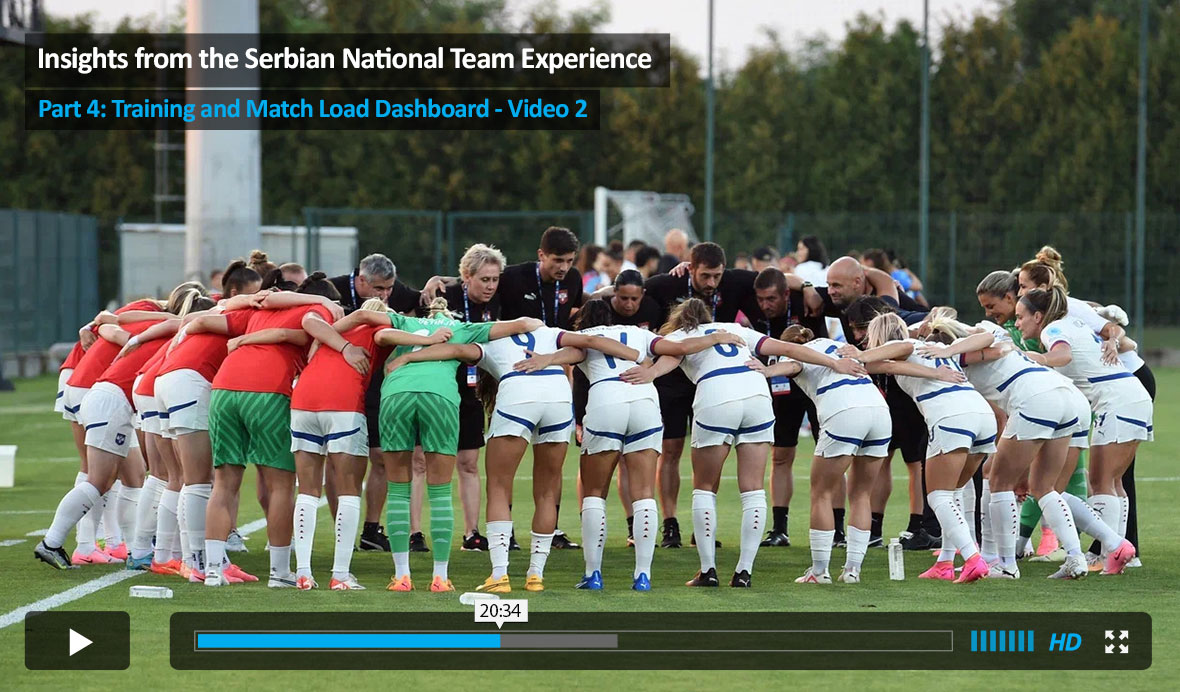
The next video demonstrates the Training and Match Load Dashboard implemented using the Quarto Dashboards library of the R language.
If you are interested in doing monitoring data analysis, make sure to check out our course, Athlete Monitoring: Data Analysis and Visualization.


Responses