“Power” to detect statistically significant effects based on sample size and magnitudes of effects
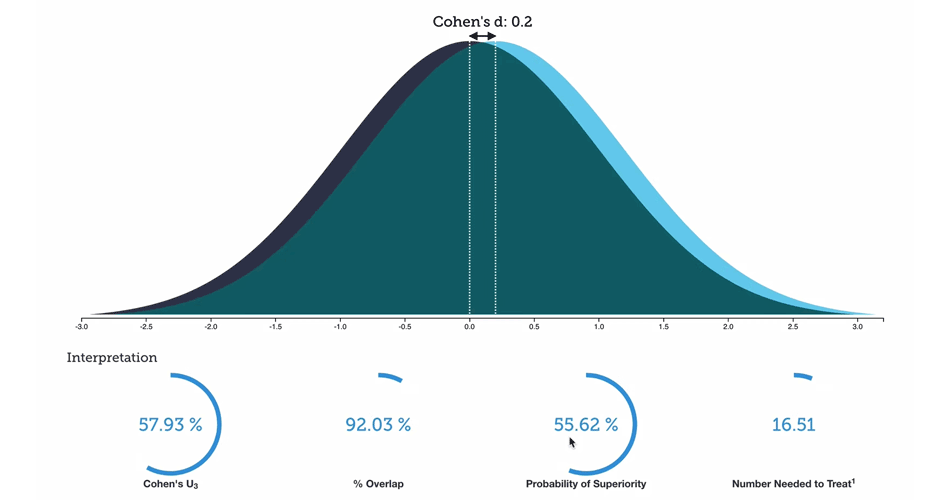
I was going through magnitude-based inferences materials by Will Hopkins and I am playing with R simulations. I wanted to see how many times I am able to detect statisticaly significant effects (p<0.05) depending on magnitude of effects (expressed as Cohen’s D, and using Will Hopkins levels) and sample sizes.
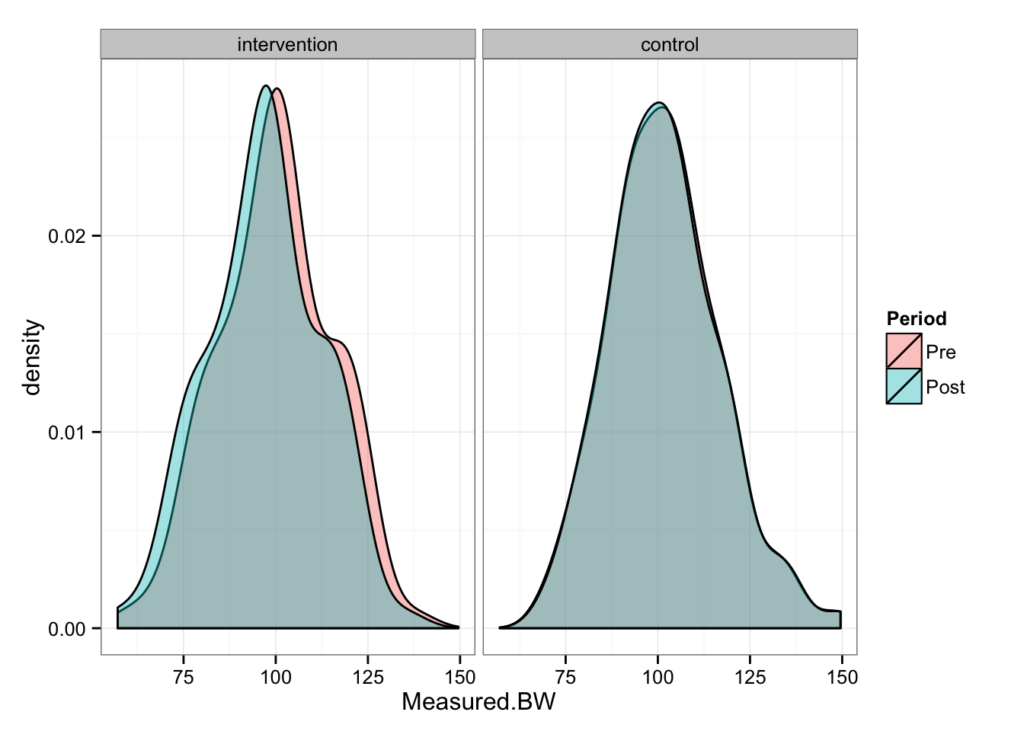
What I did is created a baseline group (mean = 100, SD = 10), and 5 more groups based on magnitude of difference (Trivial, Small, Medium, Large, Very Large) and repeated this for different number of subjects. Then I calculated p values using t test between baseline group and 5 other groups for each number of subjects. Then I repeated this process 1000 times and counder significant effects (p<0.05).
The result is the table showing how many times (percentage) in those 1000 resampling I was able to detect statisticly significant effect depending on the number of subjest of magnitude of change (from baseline group).
Here is the code and the resulting table:


Responses