Making Sense Out of the Session GPS Data
We collect more and more data and it is becoming increasingly difficult to make meaning out of it. I have found the following picture from MATLAB Fuzzy Logic toolbox to perfectly depict my current thought process.
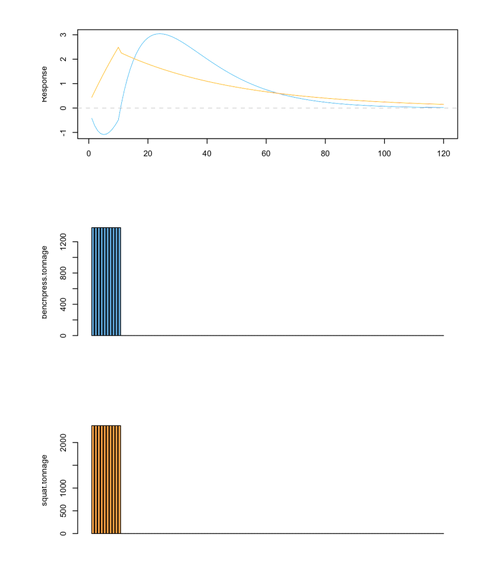
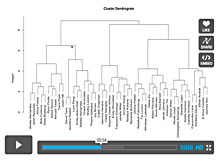
What I would like to do is to present one simple way to make the meaning out of session GPS data using LOF and Clustering. Most GPS units produce multiple features p compared to number of observations n, so we are basically dealing with high-dimensional data where classical approaches such as least squares linear regression are not appropriate. Besides, we do not know what is the predicted/outcome variable, hence we are dealing with unsupervised learning problem.
Here is one randomly generated session GPS output:
[iframe src=”http://complementarytraining.net/wp-content/uploads/2013/10/Making_sense_out_of_session_GPS_data_non-member.html” width=”100%” height=”auto” class=”iframe-non-members”]


Responses