Fantastic Sport Analytics Papers & Resources
I have recently stumbled on a few great papers that outline very useful statistical (or should I say machine learning and data mining) techniques, that are VERY applicable to sport and training analytics. Besides, most of them provide free R/Shiny code, as well as data sets. So, if you are interested in analytics, this is a gold mine.
Archetypal Analysis
Archetypal analysis is similar to cluster analysis (finding groups in data), with a difference that archetypal analysis finds ‘archetypal’ athletes (or extreme cases) and later on rate other athletes, based on those archetypes. Together with cluster analysis, this is very useful in rating athletes, figuring out groups for ‘individualized’ training, grouping training drills (finding archetypal training drills) and so forth.
Few papers also outlined ‘novel’ functional data analysis (representing longitudinal data with a mathematical function), which I believe is the next big thing, (if not already) together with ‘deep learning’ in sport analytics.
- Eugster, M. J. A. & Leisch, F. From Spider-Man to Hero – Archetypal Analysis in R. Journal of Statistical Software 30, 1–23 (2009). PDF LINK
- Performance Profiles based on Archetypal Athletes. 1–23 (2012). doi:10.1080/24748668.2012.11868592. PDF LINK
- Vinué, G. & Epifanio, I. Archetypoid analysis for sports analytics. Data Mining and Knowledge Discovery 1–35 (2017). doi:10.1007/s10618-017-0514-1. PDF LINK
- Epifanio, I. Functional archetype and archetypoid analysis. Computational Statistics and Data Analysis 104, 24–34 (2016). PDF LINK
- Vinué, G. & Epifanio, I. Forecasting basketball players’ performance using sparse functional data. Statistical Analysis and Data Mining: The ASA Data Science Journal 12(6) 1-14 (2019). https://doi.org/10.1002/sam.11436
Guillermo Vinue also provided FREE software used in analytics (R/Shiny), as well as basketball data here: https://www.uv.es/vivigui/software. The above papers are excellent, since they are using basketball and software data.
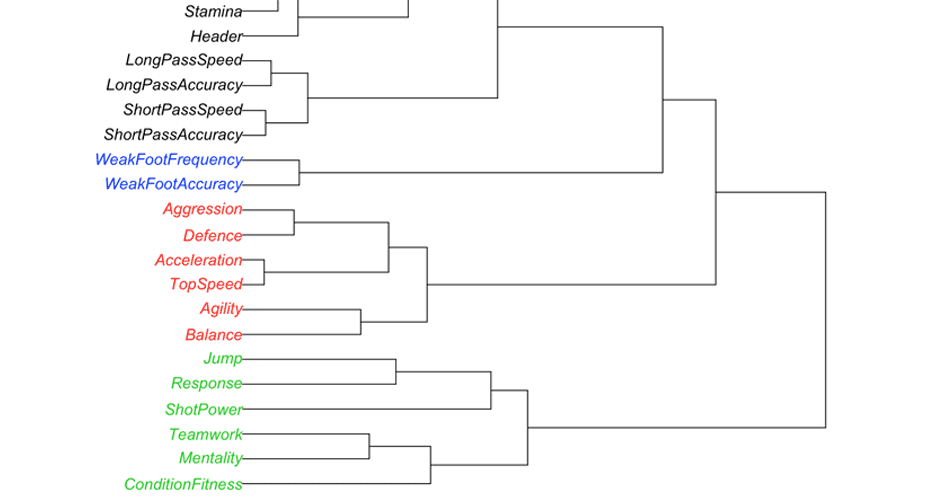
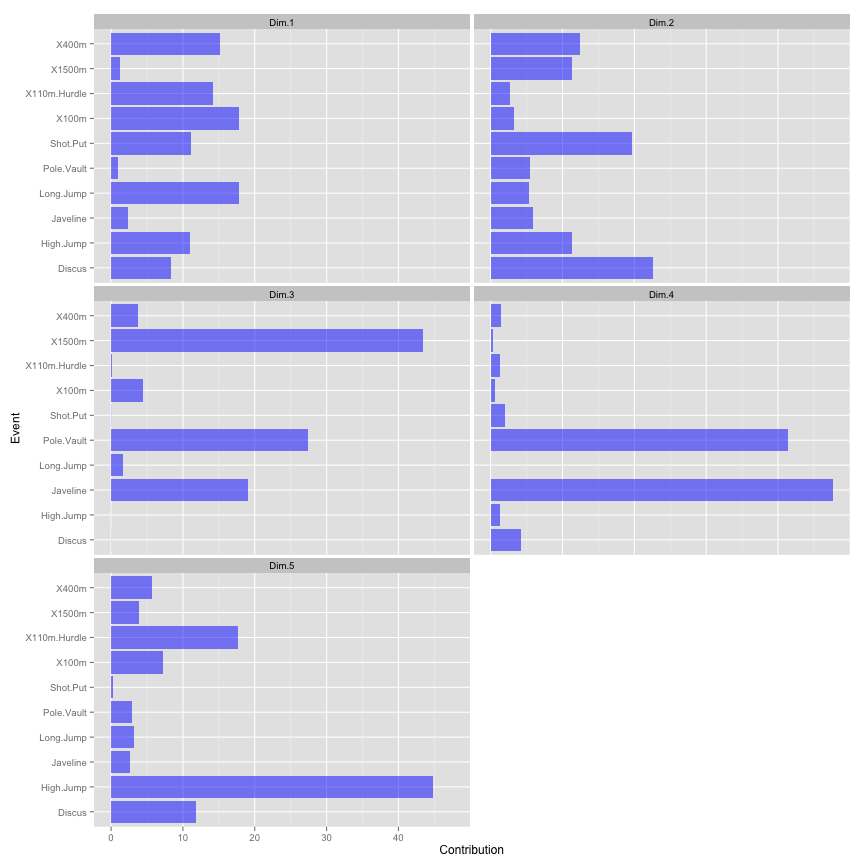
Variable Clustering
Variable clustering is a way of figuring out latent variables. Pretty much same as factor analysis, although a bit novel. The following papers I am about to read, so I can’t say much, besides that this technique can figure our hierarchical structure of your variables (features). For example, you might measure 200 metrics during various training drills, and you want to “compress” those and find ‘latent structure’. In plain English, you want to figure out which variables are related to each other. R Package “ClustVarLV” and “ClustOfVar” can be very handy, as well as the following papers:
- Chavent, M., Kuentz-Simonet, V., Liquet, B. & Saracco, J. ClustOfVar: An RPackage for the Clustering of Variables. Journal of Statistical Software 50, 1–16 (2012). PDF LINK
- ClustVarLV: An R Package for the Clustering of Variables Around Latent Variables. 1–15 (2016). The R Journal Vol. 7/2, December 2015. PDF LINK
GPS Data Analysis
Sine I am a firm believer in ’embedded’ testing, we can utilize continuous GPS monitoring of the training session to create athlete profiles. There are a few that we can implement – for example, we might find highest velocity for given rolling window (e.g. 5sec, 10sec, 30sec, 1min, 5min, 10min and so forth), which would be good guess into endurance of the athlete, as well as the ‘worst-case-analysis’. Or, we might calculate the distribution of velocities (usually the “power distribution”), or training distribution and concentration profiles (see the references below). If anyone is willing to send me a month worth of GPS raw files (I need Velocity data and PlayerLoad2D) for a single anonymous player, I would be more than happy to provide an analysis and make R code publicly available.
- Passfield, L. & Hopker, J. G. A Mine of Information: Can Sports Analytics Provide Wisdom From Your Data? International Journal of Sports Physiology and Performance 12, 851–855 (2017). PDF LINK
- Kosmidis I, Passfield L. Linking the performance of endurance runners to training and physiological effects via multi – resolution elastic net. arXiv preprint 2015; arXiv :1506.01388. PDF LINK
Also, check a fantastic free package by Kosmidis “trackeR” for analyzing GPS data (running and cycling) on GitHub
FFTress
Nathaniel Phillips et al. wrote state of the art article on prediction, heuristics and using simple fast and frugal trees. The paper is freely available, as well as the Shiny app that you can use and play with.
- Phillips, N, D., Neth, Hansjörg, Woike, J. K., & Gaissmaier, W. (2017). FFTrees: A toolbox to create, visualize, and evaluate fast-and-frugal decision trees. Judgment and Decision Making, 12(4), 344-368. PDF Link
Statistical Rethinking
The book Statistical Rethinking is one of my favorite stats book and a great introduction to Bayesian methods. The author Richard McElreath is publishing his course on Youtube and it is worth checking out.
https://www.youtube.com/playlist?list=PLDcUM9US4XdM9_N6XUUFrhghGJ4K25bFc


Responses