Insight from the Croatian Youth National Football Team – Part 3
In this part of the blog, we’ll explore the role of monitoring methods in managing player performance during training camps. Effective monitoring helps us adjust training loads, track recovery, and ensure that players are in their best condition for competition. We’ll dive into how the Circular Causality model guides our process, using both external data like GPS metrics and internal feedback from players to refine our approach. Additionally, we’ll discuss the concept of the Readiness Coefficient—a tool to evaluate how prepared a player is based on various physical and contextual factors. Finally, we’ll touch on how we share this data with coaches and clubs, creating a streamlined flow of information that aids in the decision-making process. This structured approach allows us to stay proactive, plan ahead, and ensure that players receive the support they need to perform at their best.
6. Monitoring Methods and data sharing
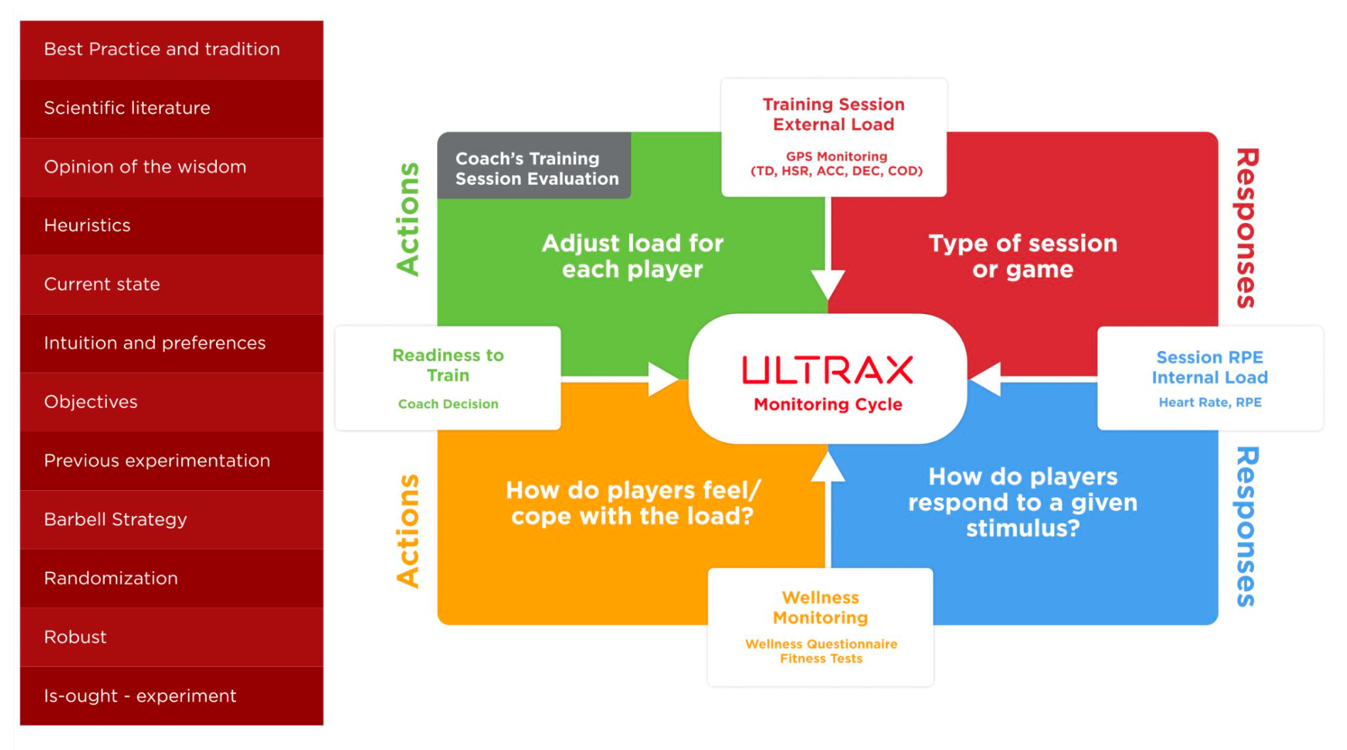
Let’s start with the Circular Causality Model to explain it through a training scenario.

Figure 12. Monitoring cycle (Modificated from Kyprianou & Farioli, left side is added from Mladens Strength Training Manual)
During pre-training meetings, we plan the content: repetitions, sets, rest durations, intensities, field dimensions, and other parameters. Post-training, we analyze external responses through GPS data, evaluating both volume and intensity on individual and team levels. I prefer translating this into practical recommendations for coaches, sometimes backed by numbers, but always with a clear verbal report. This is a prime example of monitoring, but it can also serve as a form of in situ testing and defining velocity or acceleration profile (check work from JB Morin and Samozino about this topic: (https://jbmorin.net/2021/07/29/the-in-situ-sprint-profile-for-team-sports-testing-players-without-testing-them/).
For instance, we can track max speed, acceleration, and deceleration during camp using GPS, which gives insight into a player’s current capabilities. It’s not the full picture but can be a piece of it. I won’t go too deep into the topic of GPS to avoid turning this article into a technical breakdown about the technology.
Next, we assess the internal response, gathering subjective measures of perceived exertion daily—sometimes via pen and paper, other times with BI platforms. Then the next day, we wanted to check the responses after the session before, for example, monitoring the wellness questionnaire (on MD-2 and MD-1) by tracking sleep quality, muscle fatigue, general fatigue, stress, and mood, rated on a scale of 1-5. The pain scale was filled before and after every training session, offering immediate feedback for potential intervention. Mladen also discussed pain periodization, as an important concept to consider when working with players who have a history of injuries or are in the rehabilitation process. This entire cycle closes the loop, ensuring a continuous process of tracking, evaluating, and adjusting training strategies.

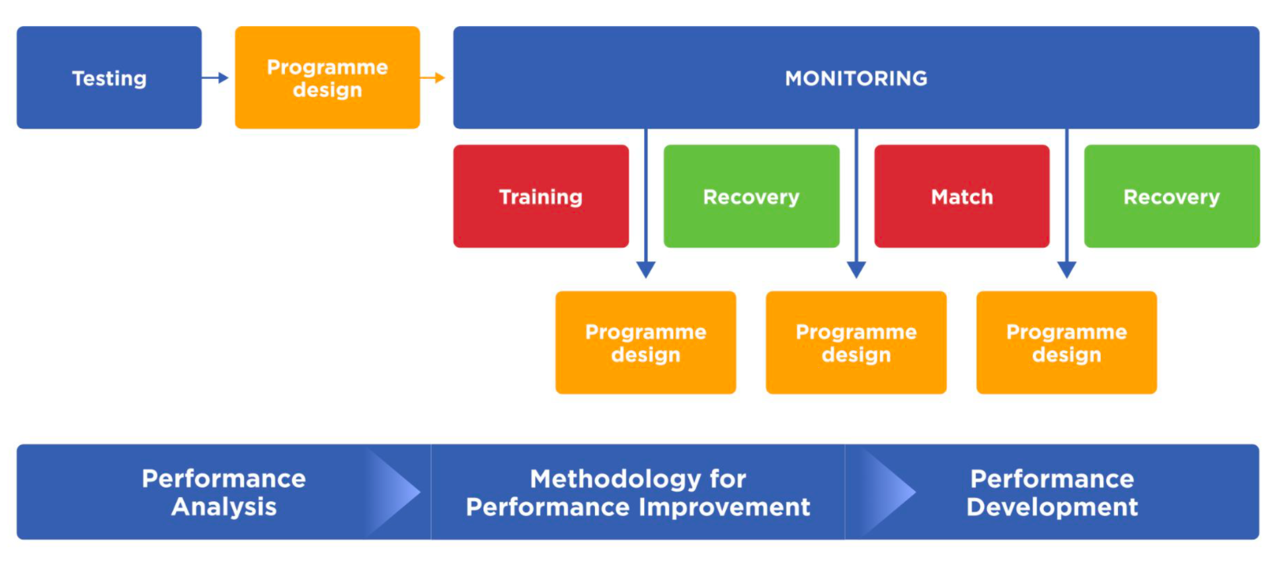
Figure 13. Agile Periodisation Example (Jukic, 2020)
Readiness coefficient
As I mentioned earlier in the text, my interest was in understanding the condition players were in when they arrived at camp. Here, I want to introduce the concept of a readiness index, which could help evaluate players’ preparedness by integrating various data points such as physical condition, previous load, recovery status, and travel effects. The initial idea was to create a Readiness Coefficient based on chronic load (average of the last 4 weeks), acute load(last 7 days), and game GPS values, especially considering their match load in the days immediately preceding the gathering.
To calculate a meaningful readiness coefficient, one might combine several factors that capture both the player’s acute and chronic load, as well as their recovery time.
ACWR: This is a common metric used to assess a player’s readiness” calculated by dividing the acute load (last 7 days) by the chronic load (last 4 weeks).
- ACWR = Acute Load / Chronic Load
- ACWR Interpretation:
- An ACWR around 0.8 – 1.3 is typically considered safe.
- Values above 1.5 indicate increased injury risk due to overloading.
- Values below 0.8 could indicate undertraining, reducing match readiness.
Game Load Adjustment Factor
Since one can be particularly interested in players who played one, two, or three days before the gathering, the match load can be factored in. For example, let’s define a Game Load Factor based on how recently the player participated in a match:


Responses