How to Easily Make Sense of Your Training Load Data Using TSB
Training Stress Balance (TSB) is a concept I first heard of in Training and Racing with Power Meter by Allen and Coggan in 2010 and I immediately found it very interesting and tried implementing a couple of times.
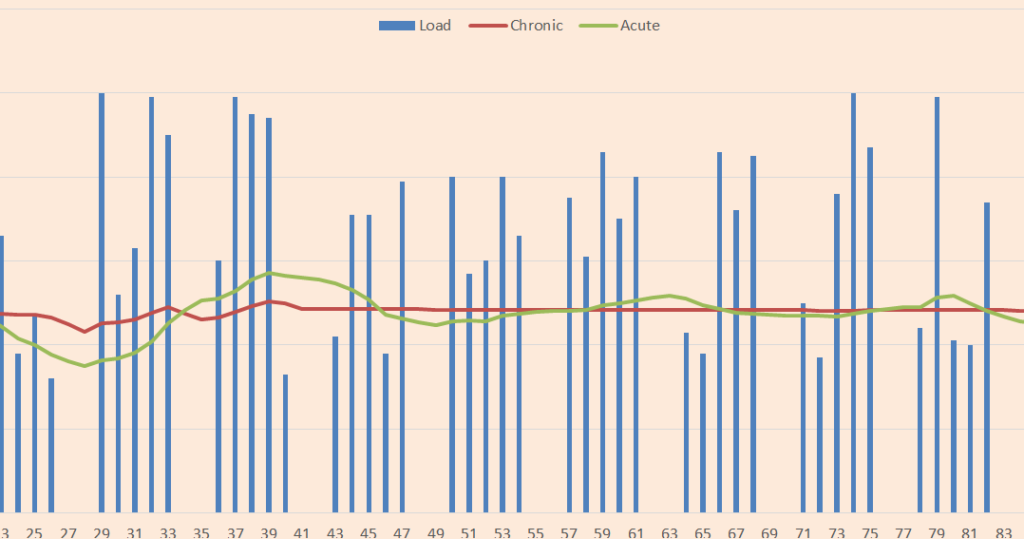
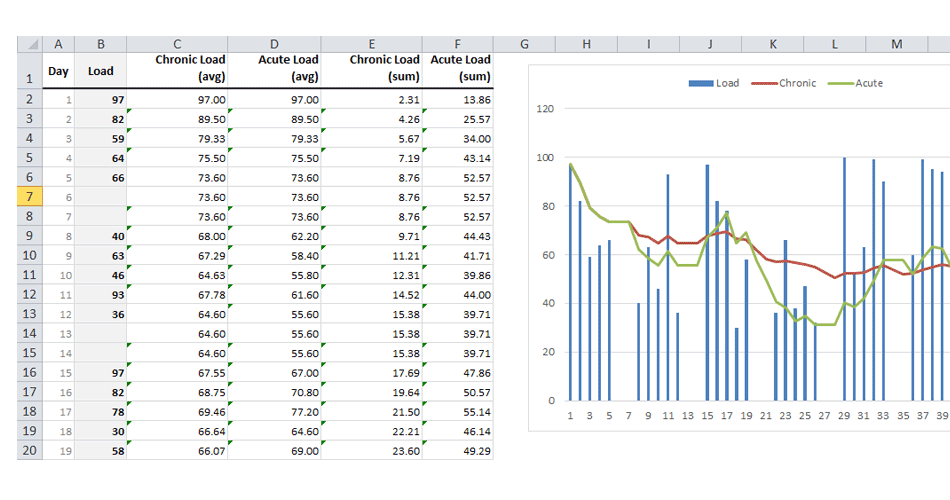
TSB revolves, similar to Banister model, around Chronic (CTL) and Acute training load (ATL). The chronic load is usually the rolling average of the last 4-6 weeks (this is called the time constant) and represents “baseline” and current level of fitness. Acute training load is usually a rolling average of the last 5-14 days (usually 7) and represents “freshness” (or the opposite, “overload”).
Training Stress Balance is then TSB = CTL – ATL, and represents their “interaction”, basically hinting about how much is the recent loads higher/lower compared to more chronic loads. If one increases ATL too quickly and too much over the CTL, one will probably suffer from fatigue-related problems (and possibly injuries). If ATL is below CTL, one will probably feel much fresher (as in tapering), but will soon start de-training.
The goal of training is hence to slowly raise (or keep relatively constant) CTL (or as I would like to say “raising the floor” while others might call it “slow cooking the athlete”) with occasional high/fast increases in ATL either to peak or to provide overload.
I have been playing with TSB and tried to actually predict the performance, but I haven’t got any better results than Banister model. The TSB model is very simple:
Test Result = CTL * k1 – ATL * k2 + test_result
One needs to optimize five parameters to find the smallest sum of squares:


Responses